· Dayo Adetoye (PhD, C|CISO) · Managing Uncertainty and Complexity · 27 min read
Beyond the Boom:
How Controls Attenuate Loss Magnitude
Can your security program tell the difference between a control that stops the bullet and one that stops the bleeding? Most can't: and that blind spot is costing you more than you think.
Introduction
In a previous post, I introduced Threat Mitigation Potential (TMP): a framework for quantifying how effectively a security control prevents threat events from materializing. TMP captures the probability that a control will successfully block, detect, or deflect an attack, accounting for its inherent efficacy, the decay of confidence over time, and the breadth of its deployment across your assets.
TMP is a powerful tool. But it has a blind spot.
The Prevention Blind Spot
While TMP is a powerful tool for quantifying how well a control prevents an attack, it has a critical blind spot: it cannot measure how well a control reduces damage when prevention inevitably fails.
Consider this scenario: your organization deploys a robust backup solution with immutable snapshots, automated restore testing, and 99.5% coverage across all critical systems. Under TMP analysis, this control scores essentially zero against a ransomware threat. Backups don’t prevent ransomware from encrypting your systems. They don’t reduce the probability of the attack. They don’t block the initial phishing email, stop the payload from executing, or prevent lateral movement.
And yet, any experienced security professional will tell you that backups are among the most valuable controls you can have against ransomware. An organization with tested, immutable backups facing a ransomware attack is in a fundamentally different position from one without them: not because the attack didn’t happen, but because the damage is dramatically reduced.
This is the gap that TMP, by design, does not address. TMP lives entirely on the frequency side of the risk equation. It asks: “How likely is it that this control prevents the event?” But risk has two dimensions:
This blog post explores the other side of that equation, the magnitude side, and introduces a companion framework for understanding how controls reduce the severity of losses when prevention fails.
Article Map
This is a long-form article. Use the links below to jump to the sections most relevant to you.
- The Boom: A Line in the Sand: Defines “left of boom” vs. “right of boom” and maps the concepts to the FAIR ontology.
- A Taxonomy of Controls: Introduces three archetypes: Pure Shields, Pure Shock Absorbers, and Hybrid Controls, with real-world examples of each.
- Five Scenarios: Ransomware, insider theft, cloud misconfiguration, supply chain compromise, and DDoS: worked scenarios showing what frequency-only analysis misses.
- Introducing LMAP: The formal definition of Loss Magnitude Attenuation Potential: attenuation effectiveness, efficacy decay, and deployment coverage.
- Dual-Scoring & the Combined Formula: How to score every control on both TMP and LMAP, stack multiple controls without double-counting, and compute the combined Risk Reduction Potential (with a fully worked ransomware example).
- Why Magnitude Controls Are Undervalued: Five systemic forces that bias organizations toward prevention spending.
- The Balanced Portfolio: A threat-by-threat framework for ensuring strength on both sides of the boom.
- CISO Board Narratives: Six ready-to-use talking points for translating this framework into board-level conversations.
- Conclusion: Key takeaways and the two questions every control should answer.
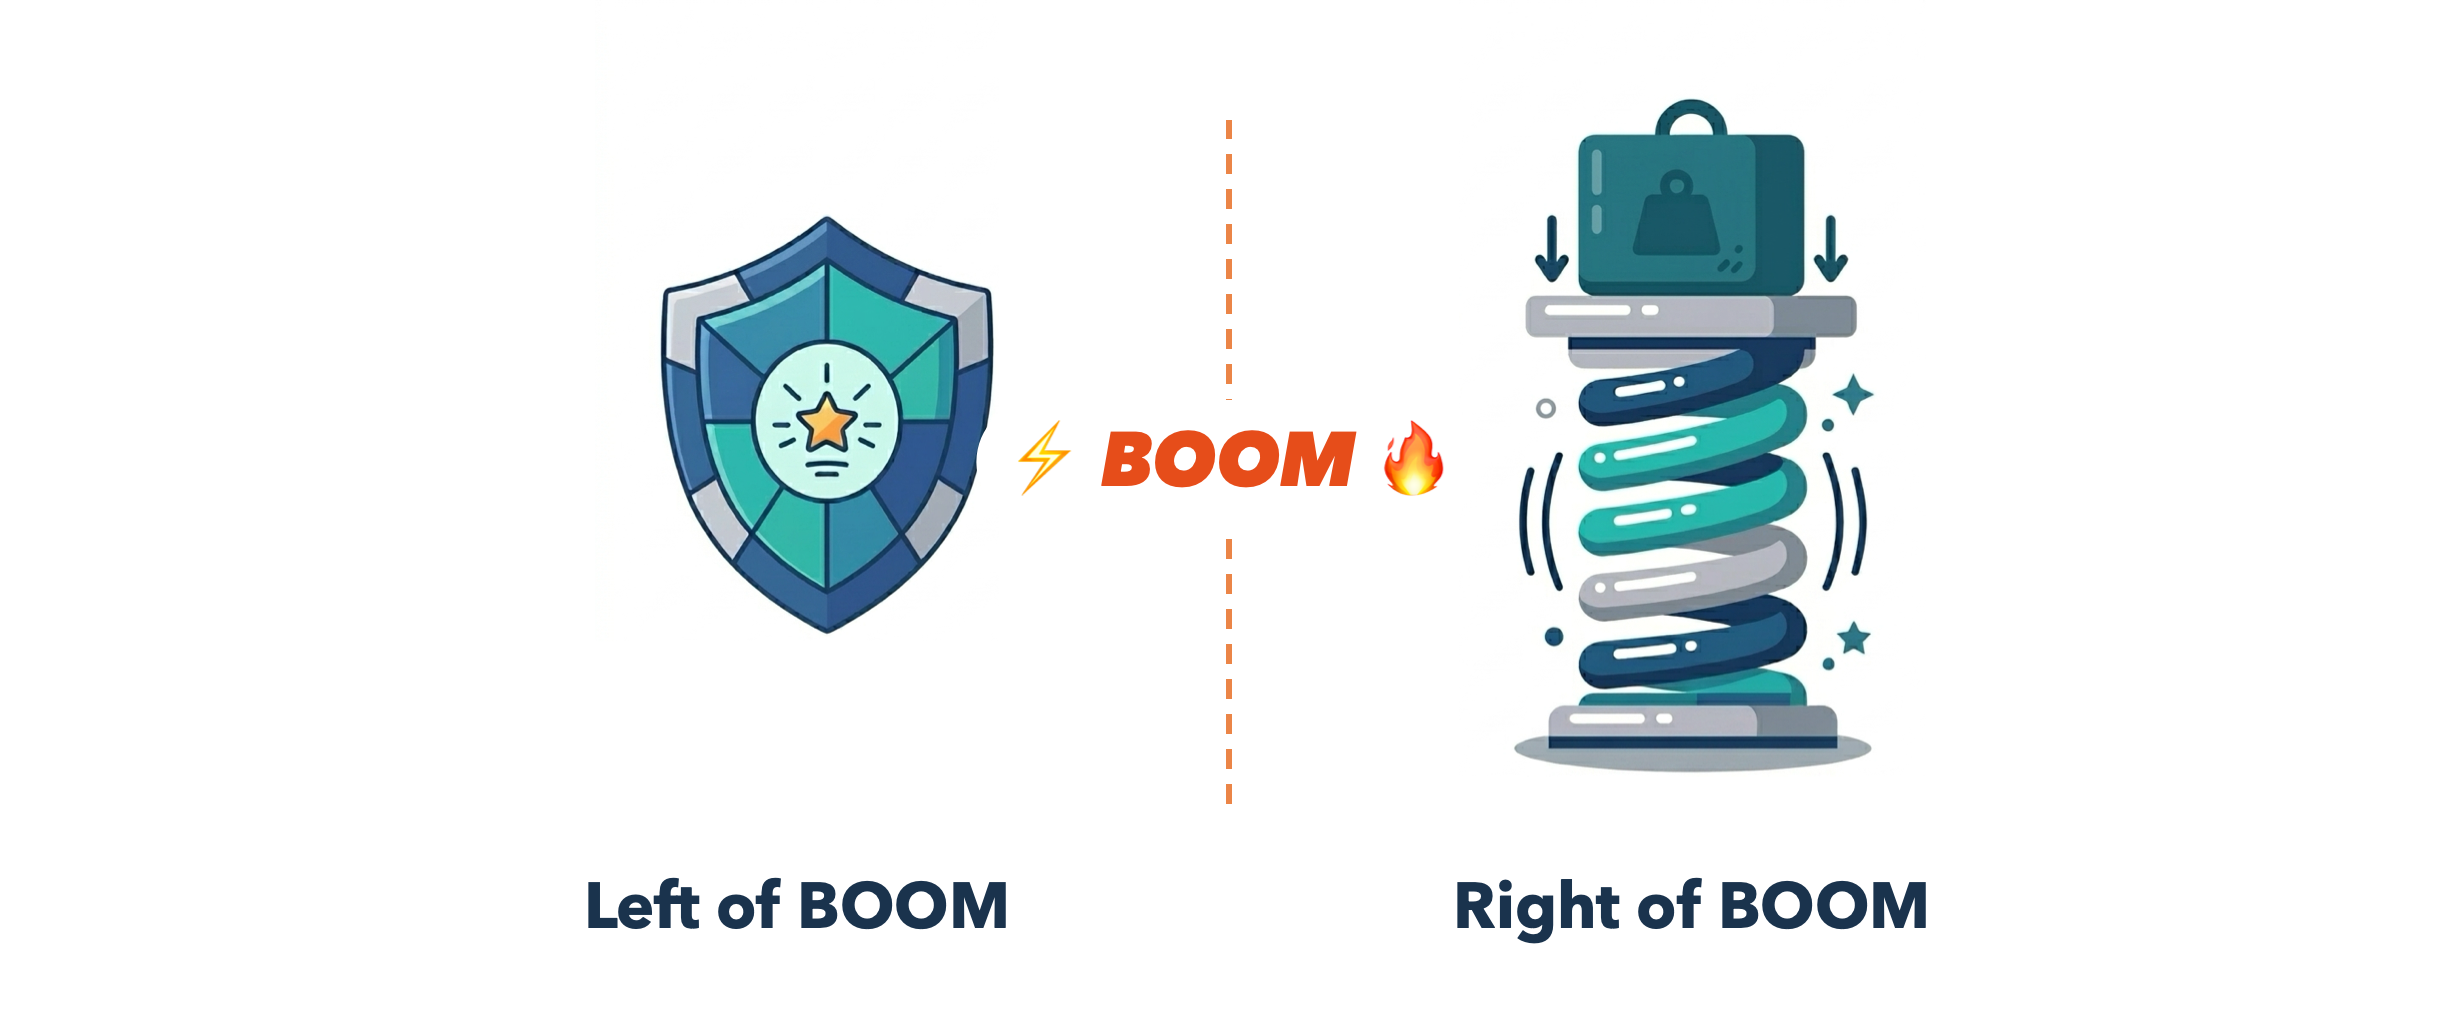
The Boom: A Line in the Sand
In cybersecurity, we often talk about “left of boom” and “right of boom”: borrowing military terminology for the moments before and after a catastrophic event. If we map this to the FAIR ontology, the boom aligns perfectly with the Loss Event. It’s the instant the ransomware encrypts, the moment the data is exfiltrated, the second the system goes down. Everything left of boom (reducing Loss Event Frequency) is about preventing the event. Everything right of boom (reducing Loss Magnitude) is about surviving it.
This temporal boundary creates a natural taxonomy for security controls:
| Attribute | Left of Boom | Right of Boom |
|---|---|---|
| Objective | Prevent the loss event from occurring | Reduce the severity of the loss event after it occurs |
| Acts on | Loss Event Frequency (LEF) | Loss Magnitude (LM) |
| Metaphor | Shield: deflects the blow | Shock Absorber: absorbs the impact |
| Failure mode | The event happens | The event is catastrophic |
| Measured by | Threat Mitigation Potential (TMP) | Loss Magnitude Attenuation Potential (LMAP): introduced in this post |
This distinction has profound implications for how we evaluate, prioritize, and invest in controls. A security program that only measures the shield effectiveness of its controls is flying half-blind: it knows how likely it is to be hit, but not how badly it will bleed.
Shields and Shock Absorbers: A Taxonomy of Controls
We identify a taxonomy of controls based on where they sit relative to the boom: left of boom (shields) and right of boom (shock absorbers) or across both sides of the boom. This gives us three archetypes:
- Pure Shields (Left of Boom Only): Controls that exist solely to prevent threat events from materializing. If prevention fails, they provide no damage reduction. High TMP, zero LMAP.
- Pure Shock Absorbers (Right of Boom Only): Controls that provide no prevention capability whatsoever, but reduce the magnitude of loss after an event occurs. Zero TMP, potentially very high LMAP.
- Hybrid Controls (Both Shield and Shock Absorber): Controls that operate on both sides of the boom: reducing the probability of the event and limiting the damage if it occurs anyway. Non-zero TMP and non-zero LMAP.
Let’s populate each archetype with real-world examples.
Archetype 1: Pure Shields (Left of Boom Only)
These controls exist solely to prevent threat events from materializing. If the event occurs despite them, they provide no benefit whatsoever in reducing the damage.
| Control | Threat | How It Shields (Left of Boom) | Right of Boom Value |
|---|---|---|---|
| Multi-Factor Authentication (MFA) | Credential stuffing | Blocks login attempts even with valid stolen passwords | Zero: once the attacker bypasses MFA (e.g., session hijack, MFA fatigue), the control offers no damage reduction |
| Email Gateway Filtering | Phishing | Prevents malicious emails from reaching user inboxes | Zero: if the phish gets through and the user clicks, the email filter has no further role |
| Patch Management | Vulnerability exploitation | Closes known vulnerabilities before attackers exploit them | Near-zero: if a patched system is compromised anyway (e.g., zero-day or stolen credentials), the patch itself may offer very little assistance to contain the attacker or reduce data loss |
| Web Application Firewall (WAF) | SQL injection, XSS | Blocks malicious HTTP requests at the perimeter | Zero: if a crafted request bypasses the WAF, there’s no secondary protection from the WAF itself |
| Input Validation | Injection attacks | Sanitizes user inputs to prevent code execution | Zero: if validation is bypassed, the control provides no containment |
Key Insight: Pure Shields
Pure shields have high TMP but zero LMAP. They are binary in nature: either the attack is stopped, or the control has no further contribution. This makes them essential but insufficient on their own.
Archetype 2: Pure Shock Absorbers (Right of Boom Only)
These controls provide no prevention capability: they don’t reduce the likelihood of the event at all. Their entire value lies in reducing the magnitude of loss after the event occurs.
| Control | Threat | Left of Boom Value | How It Absorbs (Right of Boom) |
|---|---|---|---|
| Immutable Backups | Ransomware | Zero: Backups don’t prevent encryption | Enables full system restoration, reducing downtime from weeks to hours and eliminating ransom payment |
| Cyber Insurance | Any loss event | Zero: Insurance doesn’t prevent attacks | Transfers financial magnitude to the insurer, capping out-of-pocket losses |
| Crisis Communication Plan | Data breach | Zero: A PR plan doesn’t stop the breach | Reduces reputational damage through coordinated, timely disclosure and stakeholder management |
| Disaster Recovery Site | Infrastructure destruction | Zero: A DR site doesn’t prevent the primary site from failing | Enables rapid failover, reducing operational downtime from days to minutes |
| Legal Retainer / Breach Counsel | Regulatory action post-breach | Zero: Lawyers don’t prevent breaches | Reduces regulatory fines and litigation costs through expert response and negotiation |
| Kill Switches / Circuit Breakers | System compromise | Zero: They don’t prevent the initial compromise | Immediately halt the spread of damage by isolating affected systems once compromise is detected |
Key Insight: Pure Shock Absorbers
Pure shock absorbers have TMP ≈ 0 but potentially very high LMAP. These are the controls that traditional frequency-focused analysis systematically undervalues.
Archetype 3: Hybrid Controls (Both Shield and Shock Absorber)
The most interesting, and often most valuable, controls operate on both sides of the boom. They reduce the probability of the event and limit the damage if it occurs anyway.
| Control | Threat | Shield Effect (Left of Boom) | Shock Absorber Effect (Right of Boom) |
|---|---|---|---|
| Network Segmentation | Lateral movement | Creates barriers that reduce the probability of an attacker reaching critical assets | Limits the blast radius: a compromised segment doesn’t grant access to the entire network |
| EDR with Automated Response | Malware | Detects and blocks malicious processes before execution | Isolates compromised endpoints automatically, preventing spread after initial infection |
| Encryption at Rest | Data theft | May deter opportunistic attackers who can’t use encrypted data (marginal) | Renders stolen data unusable, dramatically reducing data exposure magnitude |
| Privileged Access Management (PAM) | Insider threat, credential theft | Restricts who can access sensitive systems, reducing attack surface | Limits what a compromised privileged account can reach through session controls, JIT access, and vaulting |
| Zero Trust Architecture | Any network-based threat | Continuous verification reduces the probability of unauthorized access | Microsegmentation and least-privilege ensure that a breach of one component doesn’t cascade |
| Data Loss Prevention (DLP) | Data exfiltration | Blocks outbound transfers of sensitive data (prevention) | In alert-only mode, enables rapid detection and response, limiting the volume of data exfiltrated |
| Incident Response Plan (tested) | Any loss event | Regular tabletop exercises may surface vulnerabilities proactively (marginal TMP) | Dramatically reduces dwell time, containment time, and overall loss magnitude through rehearsed, coordinated action |
Key Insight: Hybrid Controls
Hybrid controls are disproportionately valuable because they contribute to both dimensions of risk reduction. Yet without a dual-scoring framework, their full value remains invisible.
Five Scenarios That Expose the Magnitude Blind Spot
To sharpen the intuition further, let’s walk through five scenarios where a frequency-only analysis leads to a dangerously incomplete picture.
Scenario 1: Ransomware - The Canonical Case
The attack: An employee clicks a phishing link. Malware executes, escalates privileges, and deploys ransomware across the network. 2,000 systems are encrypted. The attacker demands $5M.
| Control | TMP Score | LMAP Score | Contribution |
|---|---|---|---|
| Email filtering | High | None | May have blocked the phishing email (but didn’t) |
| EDR | High | Medium | May have detected the payload (but didn’t); may have auto-isolated some endpoints |
| Immutable backups | None | Very High | Zero prevention, but enables full restoration without paying ransom |
| Network segmentation | Medium | High | May have slowed lateral movement; definitely limited the blast radius to fewer segments |
| MFA | Medium | None | May have slowed privilege escalation |
| Incident response plan | None | High | Enables coordinated containment and recovery, reducing downtime from weeks to days |
The Lesson
If you score controls only by TMP, the three most impactful controls right of boom: backups, segmentation, and IR planning: are either invisible or severely underweighted. An organization that invests exclusively in high-TMP controls (email filtering, EDR, MFA) and neglects backups and IR planning is optimizing for a world where prevention never fails. That world doesn’t exist.
Scenario 2: Insider Data Theft - The Slow Bleed
The attack: A disgruntled employee with legitimate database access begins exfiltrating customer records over six weeks, transferring small batches to a personal cloud account.
| Control | TMP Score | LMAP Score | Contribution |
|---|---|---|---|
| Access reviews / RBAC | Medium | None | Might have removed excessive permissions, but the access was legitimately granted |
| DLP (alert mode) | Low | High | Didn’t block the transfers, but detection alerts enabled security to discover the exfiltration after 2 weeks instead of 6, reducing records exposed from 500K to 150K |
| Data tokenization/masking | None | High | Sensitive fields are replaced with tokens or masked values; even if the insider exports records, the exfiltrated data has limited usable PII |
| Database activity monitoring | Medium | Medium | May have flagged unusual query patterns (prevention via deterrence); also provides forensic evidence to scope the damage |
| Legal/breach counsel | None | High | Expert guidance on notification obligations reduces regulatory exposure |
The Lesson
In insider threat scenarios, prevention is inherently limited because the adversary has legitimate access. Magnitude-reducing controls: DLP detection, tokenization, legal response: are often the primary line of defense. A TMP-only analysis would rank access reviews highest and leave the organization exposed to the full force of the loss.
Scenario 3: Cloud Misconfiguration - The Open Door
The attack: A developer accidentally sets an S3 bucket containing 10M customer records to public access. A researcher discovers it and notifies the press.
| Control | TMP Score | LMAP Score | Contribution |
|---|---|---|---|
| Cloud Security Posture Management (CSPM) | High | None | Should have detected and remediated the misconfiguration before exposure |
| IaC (Infrastructure as Code) templates | High | None | Should have enforced private-by-default bucket policies |
| Encryption at rest | None | Very High | Even though the bucket was public, the data is encrypted: an attacker who downloads the files gets ciphertext, not plaintext |
| Data classification & minimization | None | High | If the bucket only contained non-sensitive data due to classification policies, the magnitude drops dramatically |
| Incident response & PR plan | None | High | Rapid, transparent response reduces reputational and regulatory damage |
The Lesson
Misconfigurations are among the most common cloud security incidents. When prevention (CSPM, IaC) fails, the entire defensive burden shifts to magnitude-reducing controls. Encryption at rest transforms a catastrophic data breach into a non-event: the data is exposed but unusable. This is LMAP at its most powerful.
Scenario 4: Supply Chain Compromise - The Trojan Update
The attack: A trusted vendor’s software update mechanism is compromised. A malicious update is pushed to 500 of your endpoints, installing a backdoor.
| Control | TMP Score | LMAP Score | Contribution |
|---|---|---|---|
| Vendor risk assessment | Low | None | Pre-engagement diligence doesn’t prevent a runtime compromise of the vendor’s build pipeline |
| Software integrity verification | Medium | None | May have flagged the tampered update (if hashes were checked), but supply chain attacks are designed to pass these checks |
| Network segmentation | Low | Very High | The backdoor is deployed to 500 endpoints, but segmentation prevents the attacker from pivoting to crown jewels: 500 compromised endpoints don’t equal total network compromise |
| EDR with automated isolation | Medium | High | May detect anomalous post-install behavior and auto-quarantine affected machines, limiting the attacker’s dwell time and reach |
| Offline / air-gapped backups | None | High | If the attacker deploys a destructive payload, clean backups from before the compromised update enable recovery |
| Incident response (rehearsed) | None | Very High | Enables rapid scoping (which 500 endpoints? what did the backdoor access?), coordinated containment, and stakeholder communication |
The Lesson
Supply chain attacks are uniquely difficult to prevent because the threat vector is a trusted channel. Left of Boom controls have structurally low TMP because the attack is designed to bypass trust boundaries. In this scenario, the entire defensive value comes from right-of-boom magnitude reduction: segmentation, EDR isolation, backups, and incident response.
Scenario 5: DDoS - The Sledgehammer
The attack: A massive volumetric DDoS attack overwhelms your web application, causing 18 hours of downtime during peak trading season.
| Control | TMP Score | LMAP Score | Contribution |
|---|---|---|---|
| DDoS mitigation service (e.g., Cloudflare, Akamai) | High | Medium | Absorbs and filters attack traffic (prevention); if overwhelmed, still reduces throughput of malicious traffic (magnitude reduction) |
| Rate limiting | Medium | None | Limits request volume per source, but sophisticated DDoS uses distributed sources |
| Auto-scaling infrastructure | None | High | Doesn’t prevent the attack, but scales capacity to absorb it, reducing or eliminating downtime |
| CDN / Edge caching | Low | High | Serves cached content even if origin is overwhelmed, keeping the site partially functional |
| Runbook / failover procedures | None | High | Enables rapid traffic rerouting, customer communication, and service restoration |
| Business interruption insurance | None | Medium | Covers revenue losses during downtime |
The Lesson
DDoS is a scenario where the line between prevention and magnitude reduction is blurred. A DDoS mitigation service is a hybrid: it tries to prevent the impact but also attenuates it when overwhelmed. Auto-scaling is purely right-of-boom: it doesn’t stop the flood, but it keeps the house from flooding.
Introducing Loss Magnitude Attenuation Potential (LMAP)
Having motivated the concept through examples, let’s formalize it. Just as TMP quantifies the frequency-reducing power of a control, Loss Magnitude Attenuation Potential (LMAP) quantifies its magnitude-reducing power.
The Core Intuition
TMP answers: “Given a threat event, what is the probability this control prevents it from occurring?”
LMAP answers: “Given a threat event that has occurred (right-of-boom), by what proportion does this control reduce the resulting loss magnitude?”
The Structure
Following the same structural logic as TMP, LMAP is composed of three factors:
Attenuation Effectiveness (Attenuation): The proportion by which the control reduces loss magnitude when it functions correctly. For example, immutable backups might reduce ransomware loss magnitude by 90% (you still have incident response costs, downtime during restoration, etc.). Encryption at rest might reduce data breach magnitude by 95% (the data is exposed but unusable).
Efficacy Decay: Just as with TMP, confidence in a magnitude-reducing control decays over time without validation. Untested backups are no better than no backups. A disaster recovery plan that hasn’t been rehearsed in two years may fail under real pressure. The same exponential decay model applies.
Deployment Coverage: The proportion of relevant assets covered by the magnitude-reducing control. Backups that cover 70% of critical systems leave 30% unrecoverable. Encryption deployed on 80% of databases leaves 20% exposed in plaintext.
Where:
- Attenuation ∈ [0, 1]: The maximum proportion of loss magnitude the control can absorb when functioning perfectly.
- Coverage ∈ [0, 1]: The proportion of relevant assets where the loss magnitude-reducing control is deployed.
- : The efficacy decay factor, reflecting the decline in confidence as time passes without validation.
- : The validation cadence of the control.
- : the efficacy decay rate parameter, which reflects the rate at which confidence in the control’s effectiveness diminishes.
On the Symmetry Between TMP and LMAP
The symmetry is deliberate. TMP and LMAP are structurally identical: the same three factors, the same decay model, the same coverage concept. The only difference is what they measure: TMP measures the probability of preventing the event; LMAP measures the proportion of loss magnitude absorbed after the event.
The Decay Symmetry: Why Untested Backups Are as Dangerous as Untested Firewalls
This point deserves emphasis. The efficacy decay model in TMP and LMAP captures a critical truth: a firewall, like a backup, that you haven’t tested in six months may have drifted into a misconfigured state, and your confidence in it should decay accordingly.
The same truth applies with equal force to right-of-boom as it does to left-of-boom controls:
| Control | What Decays Without Testing |
|---|---|
| Backups | Backup jobs may silently fail. Storage may corrupt. Restore procedures may break after infrastructure changes. A backup you haven’t test-restored is Schrödinger’s backup: it is simultaneously functional and failed until you observe it. |
| Disaster Recovery | Failover procedures may reference outdated IP addresses, deprecated APIs, or decommissioned systems. DR that worked 18 months ago against last year’s architecture is a gamble against today’s. |
| Incident Response Plan | Staff turnover means key responders may not know their roles. Escalation contacts change. Legal counsel’s retainer may have lapsed. A plan that sits unexercised is a plan that will stumble. |
| Encryption | Key management procedures may have decayed. Keys may have been leaked, rotated improperly, or stored in locations that are themselves unencrypted. |
The Implication of the Symmetry
The implication is clear: magnitude-reducing controls require the same continuous validation discipline as frequency-reducing controls. The decay model is not just analogous, it is identical. See how the decay is derived in the TMP Model. This means that just as a penetration test resets the decay curve for a firewall, a backup restoration test resets the decay curve for a backup.
Dual-Scoring Controls: The Full Picture
With both TMP and LMAP defined, every control in your security program can be scored on two dimensions:
| Control | TMP (Left of Boom) | LMAP (Right of Boom) | Profile |
|---|---|---|---|
| Multi-Factor Authentication | High | None | Pure Shield |
| Email Gateway Filtering | High | None | Pure Shield |
| Patch Management | High | None | Pure Shield |
| Immutable Backups | None | Very High | Pure Shock Absorber |
| Cyber Insurance | None | Medium–High | Pure Shock Absorber |
| Crisis Communication Plan | None | Medium | Pure Shock Absorber |
| Network Segmentation | Medium | High | Hybrid |
| EDR with Auto-Response | High | High | Hybrid |
| Encryption at Rest | Low | Very High | Hybrid (skewed right-of-boom) |
| Privileged Access Management | High | Medium | Hybrid (skewed left-of-boom) |
| Zero Trust Architecture | High | High | Hybrid |
| Incident Response Plan (tested) | Low | Very High | Hybrid (skewed right-of-boom) |
This dual-scoring reveals something that single-dimension analysis cannot: the most resilient security programs are those that maintain strength across both columns.
A program with uniformly high TMP scores but negligible LMAP scores has optimized for a world where prevention never fails. When (not if) it does, the organization absorbs the full magnitude of the loss. Conversely, a program with high LMAP scores but weak TMP scores will survive breaches, but will experience them far too often.
Composite Risk Reduction: Combining Multiple Controls Across Both Sides of the Boom
In practice, organizations don’t deploy a single control against a threat: they deploy many. A ransomware defense might include email filtering, EDR, MFA, network segmentation, backups, and an incident response plan. Some of these are pure shields, some are pure shock absorbers, and some are hybrids that contribute to both sides.
The question becomes: how do we combine the risk-reducing effects of multiple controls without double-counting?
The key insight is that TMP and LMAP operate on orthogonal dimensions of the risk equation: frequency and magnitude, respectively. This means a single control’s TMP and LMAP contributions are never double-counted, because they act on different terms. The challenge lies in combining multiple controls within each dimension.
Stacking Shields: Multiple Controls on the Frequency Side
If we have controls with frequency-reducing capability (i.e., non-zero TMP scores), and we assume the controls act independently, then the probability that a threat event materializes despite all shields is the product of their individual failure probabilities:
Where:
- : is the number of controls with frequency-reducing capability (i.e., non-zero TMP scores).
- : is the Threat Mitigation Potential of the -th control.
This avoids double-counting naturally. Each factor represents the probability that control fails to prevent the event. The product gives the probability that all shields fail simultaneously: which is the only scenario in which the event occurs.
For example, if email filtering has TMP = 0.85 and EDR has TMP = 0.70, the residual frequency factor is not (which would be nonsensical double-counting), but rather:
Only 4.5% of threat events survive both shields: a far more defensible calculation.
Stacking Shock Absorbers: Multiple Controls on the Magnitude Side
The same logic applies right-of-boom. If we have controls with magnitude-reducing capability (i.e., non-zero LMAP scores), and they act independently, each successive shock absorber reduces the remaining magnitude, not the original:
Where:
- : is the number of controls with magnitude-reducing capability (i.e., non-zero LMAP scores).
- : is the Loss Magnitude Attenuation Potential of the -th control.
This multiplicative stacking is critical for avoiding double-counting. If backups have LMAP = 0.85 and network segmentation has LMAP = 0.60, the residual magnitude is:
Only 6% of the original loss magnitude survives both shock absorbers. Segmentation reduces the magnitude that backups didn’t already absorb.
Handling Hybrid Controls
Hybrid controls, those with both TMP > 0 and LMAP > 0, contribute to both products. Their TMP score enters the frequency product; their LMAP score enters the magnitude product. There is no double-counting because the two dimensions are mathematically independent terms in the risk equation.
For example, network segmentation might have TMP = 0.40 (it reduces the probability of lateral movement reaching critical assets) and LMAP = 0.60 (it limits the blast radius if lateral movement succeeds). The TMP of 0.40 enters the frequency product alongside other shields, and the LMAP of 0.60 enters the magnitude product alongside other shock absorbers.
The Combined Risk Reduction Formula
Bringing it all together, the expected loss for a given threat scenario, defended by a portfolio of controls (some shields, some shock absorbers, some hybrid), is:
Where:
- is the baseline Loss Event Frequency (before any controls)
- is the baseline Loss Magnitude (before any controls)
- is the Threat Mitigation Potential of control (zero for pure shock absorbers)
- is the Loss Magnitude Attenuation Potential of control (zero for pure shields)
Pure shields contribute only to the frequency product (their LMAP term is zero, so , a no-op in the magnitude product). Pure shock absorbers contribute only to the magnitude product (their TMP term is zero). Hybrid controls contribute to both. No term is counted twice.
The total Risk Reduction Potential (RRP) of the entire control portfolio is then:
Where:
- : is the Threat Mitigation Potential of control (zero for pure shock absorbers)
- : is the Loss Magnitude Attenuation Potential of control (zero for pure shields)
Worked Example: Ransomware Defense Portfolio
Let’s make this concrete with the ransomware scenario from earlier, assigning illustrative TMP and LMAP scores to each control:
| Control | Type | TMP | LMAP |
|---|---|---|---|
| Email Filtering | Shield | 0.85 | 0 |
| EDR | Hybrid | 0.70 | 0.30 |
| MFA | Shield | 0.60 | 0 |
| Network Segmentation | Hybrid | 0.40 | 0.60 |
| Immutable Backups | Shock Absorber | 0 | 0.85 |
| Incident Response Plan | Shock Absorber | 0 | 0.50 |
Step 1: Compute the Residual Frequency Factor (shields side)
Only 1.08% of baseline threat events survive all shields.
Step 2: Compute the Residual Magnitude Factor (shock absorbers side)
Only 2.1% of baseline loss magnitude survives all shock absorbers.
Step 3: Compute the Combined Risk Reduction
The portfolio achieves a 99.98% reduction in expected loss.
Now, contrast this with a shields-only portfolio (same left-of-boom controls, but no backups, no IR plan, and ignoring the LMAP contributions of the hybrids):
That looks impressive, until you realize the residual expected loss is 47× higher than the balanced portfolio ( vs ). The shields-only portfolio prevents 98.92% of expected loss, but the balanced portfolio prevents 99.98%. That difference: the gap between and , is entirely the contribution of the shock absorbers.
In absolute terms: if baseline expected annual loss is $10M, the shields-only portfolio leaves $108,000 of residual expected loss, while the balanced portfolio leaves just $2,270. The shock absorbers are worth approximately $106,000 per year in this scenario.
A Note on the Independence Assumption
The model above assumes that controls act independently: the success or failure of one control does not affect the probability of another succeeding or failing. This is a simplifying assumption that keeps the model tractable and is reasonable as a first approximation.
In practice, controls may have dependencies. For example:
- A network outage might simultaneously disable both EDR telemetry and DLP monitoring
- A supply chain compromise might bypass multiple controls that all rely on the same vendor’s trust chain
- An attacker who bypasses MFA through social engineering may also bypass security awareness training: the failure modes are correlated
Removing the Independence Assumption
For scenarios where you suspect strong correlations between control failures, more sophisticated modeling (e.g., correlated failure models or scenario-specific dependency graphs) may be warranted. However, the independent model provides a clean, defensible baseline: and crucially, it already surfaces the most important insight: you need strength on both sides of the boom.
Why Magnitude-Reducing Controls Are Chronically Undervalued
If LMAP is structurally symmetric to TMP, why do organizations consistently underinvest in magnitude-reducing controls? Several forces conspire:
1. Prevention Bias
Security culture: reinforced by frameworks, audits, and vendor marketing; overwhelmingly emphasizes stopping the bad thing from happening. “Prevent the breach” is a more compelling narrative than “survive the breach gracefully.” This creates a cognitive bias: shields feel like real security and shock absorbers feel like admitting defeat.
2. Audit and Compliance Framing
Most compliance frameworks ask: “Do you have controls to prevent X?” Far fewer ask: “If X happens despite your controls, how much damage will you sustain?” This framing steers investment toward prevention and away from resilience.
3. Measurement Difficulty
It’s relatively straightforward to measure TMP: run a penetration test or red team exercise and observe whether the control blocks the attack. Measuring LMAP is harder: it often requires simulating the consequences of a successful attack (e.g., restoring from backup, executing a DR failover, running through an IR tabletop). These exercises are more complex, more expensive, and less frequently performed.
4. The Zero-TMP Stigma
Controls with zero TMP feel like they aren’t pulling their weight. “This control doesn’t prevent anything” is a damning sentence in a budget meeting, even when the control’s LMAP is extraordinarily high. Backups, insurance, and incident response plans all suffer from this perception gap.
5. Optimism Bias
Organizations tend to overestimate the reliability of their preventive controls. If you believe your email filtering, EDR, and MFA will catch 99% of threats, the right-of-boom scenario feels remote. This optimism reduces the perceived urgency of investing in shock absorbers until the boom arrives.
The Balanced Security Portfolio
The left-of-boom / right-of-boom framework suggests a different way to think about security investment. Rather than asking “How much should I spend on prevention?” the question becomes:
The Balanced Portfolio Question
“For each threat scenario I care about, do I have adequate strength on both sides of the boom?”
A balanced portfolio might look like this:
| Threat Scenario | Left of Boom Controls (Shields) | Right of Boom Controls (Shock Absorbers) | Balance |
|---|---|---|---|
| Ransomware | Email filtering, EDR, MFA, patching | Immutable backups, segmentation, IR plan, insurance | ✅ Balanced |
| Data breach (external) | WAF, input validation, DLP (block mode) | Encryption at rest, breach counsel, notification plan | ✅ Balanced |
| Insider threat | RBAC, PAM, access reviews | DLP (alert mode), database monitoring, legal response | ✅ Balanced |
| Cloud misconfiguration | CSPM, IaC, policy-as-code | Encryption at rest, data classification, IR plan | ✅ Balanced |
| Supply chain compromise | Vendor assessment, software integrity checks | Segmentation, EDR isolation, offline backups, IR plan | ✅ Balanced |
| DDoS | DDoS mitigation, rate limiting | Auto-scaling, CDN/edge caching, failover runbooks | ✅ Balanced |
For each row, ask: “If every shield in the left column fails simultaneously, how much damage do my shock absorbers in the right column prevent?” If the answer is “not much,” you have a magnitude gap that no amount of additional prevention spending will close.
Talking to the Board: CISO Narratives for the Balanced Approach
Frameworks and formulas are tools for the security team. But the left-of-boom / right-of-boom lens is perhaps most powerful as a communication device: a way for CISOs to translate complex risk dynamics into language that boards, CFOs, and executive committees can act on. Here are six narratives that flow naturally from this framework:
1. “We invest in both brakes and airbags.”
This is the simplest reframe. Every board member understands that a car needs both strong brakes and airbags. The brakes stop the crash (left-of-boom). The airbags save lives when the brakes aren’t enough (right-of-boom). No one would argue for removing airbags because the brakes are good. Yet in cybersecurity, that’s effectively what happens when budgets flow overwhelmingly to prevention and starve resilience.
2. “Our expected annual loss is $X. Here’s how each control contributes to reducing it: and which dimension it acts on.”
The dual-scoring framework gives the CISO a quantitative story. Instead of presenting a flat list of controls and their “maturity levels,” you can present a portfolio view: “These controls reduce how often we get hit. These controls reduce how badly it hurts when we do. Together, they reduce our expected annual loss by 99.98%. If we cut the shock absorbers, that number drops to 98.9%, and our residual exposure increases 47-fold.” That’s a number a CFO can act on.
3. “We can’t prevent everything. The question is: when prevention fails, how much do we lose?”
This reframes the security conversation from the unrealistic promise of total prevention to the more mature posture of managed resilience. It shifts board expectations from “Will we be breached?” (answer: eventually, yes) to “When we are breached, what’s our exposure?”: a question the organization can actually control through right-of-boom investments.
4. “Here’s our boom resilience score for each threat scenario.”
Present the balanced portfolio table from earlier: one row per threat scenario, with shields on one side and shock absorbers on the other. For each row, show the combined Risk Reduction Potential (RRP). This gives the board a heat map of resilience: they can immediately see which threat scenarios have strong coverage on both sides, and which have a dangerous magnitude gap. A board doesn’t need to understand the mathematics: they need to see that ransomware has both shields and shock absorbers, but supply chain risk is defended almost entirely by shields with minimal right-of-boom coverage.
5. “Our backup restore was last tested 14 months ago. Here’s what that means for our confidence.”
The decay model is a powerful tool for justifying operational budgets for testing and validation. When the board asks “Why are we spending $200K on DR testing this year?”, the CISO can point to the efficacy decay curve: “Because our confidence in the DR plan decays to 40% after 6 months without testing. At 14 months, it’s below 10%. That means our $2M DR investment is currently operating at roughly 10% of its intended value. The $200K test restores it to full confidence.” That’s a return-on-investment argument, not a fear argument.
6. “Every dollar we spend on security either reduces frequency, reduces magnitude, or both. Here’s the split.”
This gives the board a new way to evaluate the security budget. Map each line item to its TMP and LMAP contributions. If 90% of spend maps to TMP and only 10% to LMAP, the portfolio is structurally imbalanced: regardless of how large the total budget is. This shifts the conversation from “Are we spending enough on security?” to the more productive “Are we spending our security budget in the right places?”
Conclusion: Two Sides of the Same Coin
Security controls are not monolithic. They operate across two fundamentally different dimensions of risk reduction, separated by the boom: the moment a loss event materializes.
Threat Mitigation Potential (TMP) captures the left-of-boom dimension: How effectively does this control prevent the event?
Loss Magnitude Attenuation Potential (LMAP) captures the right-of-boom dimension: How effectively does this control reduce the damage when prevention fails?
These are complementary dimensions of a complete defense, and not competing priorities. The same structural model: efficacy, decay, coverage applies to both, because both are subject to the same forces. Controls degrade without testing, gaps in coverage create blind spots, and confidence without validation is just hope.
The most dangerous position an organization can occupy is one where all investment flows to shields and none to shock absorbers. It’s a bet that prevention will never fail. History suggests otherwise.
The most resilient organizations are those that ask two questions about every control:
- How well does it keep the boom from happening? (TMP)
- How well does it limit the damage when the boom arrives? (LMAP)
If you can answer both, you’ve moved from security theater to security engineering.