· Dayo Adetoye (PhD, C|CISO) · Partnering with the Business  · 3 min read

Cyber Risk in Financial Terms:

Empowering Your CFO with Strategic Cyber Risk Insight.

CISOs today must communicate cyber risk in terms CFOs and boards understand: cash flow, revenue disruption, and enterprise value. This article outlines a two-phase model for communicating cyber loss: Immediate Treasury Impact and Future Value Exposure, which aligns with how CFOs think about liquidity, treasury, cash reserves and growth risk. The approach allows CISOS to translate technical incidents into a financial narrative that supports strategic planning and investment.

CISOs today must communicate cyber risk in terms CFOs and boards understand: cash flow, revenue disruption, and enterprise value. This article outlines a two-phase model for communicating cyber loss: Immediate Treasury Impact and Future Value Exposure, which aligns with how CFOs think about liquidity, treasury, cash reserves and growth risk. The approach allows CISOS to translate technical incidents into a financial narrative that supports strategic planning and investment.

Boards and CFOs don’t think in firewalls or threat actors: they think in cash flow, EBITDA, and enterprise value. If cybersecurity conversations don’t translate into these financial terms, they won’t attract the right strategic attention or investment. One of the modern CISO’s key roles is to communicate cyber risk in the language of the business - to enable smarter decision-making and long-range planning.

CFOs must plan for both near-term liquidity risks and long-term growth threats. Cyber risk spans both horizons, and structuring its financial impact accordingly helps the business prepare and respond effectively. This article introduces a two-phase loss model tailored for CFOs: Immediate Financial Impact and Future Value Exposure.

Immediate Financial Impact

Definition: Direct, quantifiable financial losses that impact current-period cash flow, EBITDA, and the balance sheet: typically incurred in the days and weeks following a cyber incident.

Positioning Immediate Financial Impact to the Board

Board Message: “These are the immediate, tangible costs that hit our financials post-event: cash outflows, EBITDA pressure, and short-term funding needs before insurance recovery begins.”


Key Metrics:

  • Incident response and forensics
  • IT/system recovery and business interruption
  • Insurance deductibles and coverage gaps
  • Regulatory fines and penalties
  • Legal fees and crisis communications

Future Value Exposure

Definition: The longer-term financial drag caused by erosion of customer trust, market competitiveness, and growth potential: manifesting over quarters, not weeks.

Positioning Future Value Exposure to the Board

Board Message: “This is the long tail: the revenue loss, churn, and valuation pressure that persist long after the systems are back online. It affects our growth trajectory and investor confidence.”


Key Metrics:

  • Increased customer churn
  • Slower new business acquisition
  • Reduced contract sizes or renewals
  • Decline in brand equity and trust metrics
  • Downward revisions in forecasts and valuation multiples

Want to see this in action? Try the interactive CFO Dashboard below.

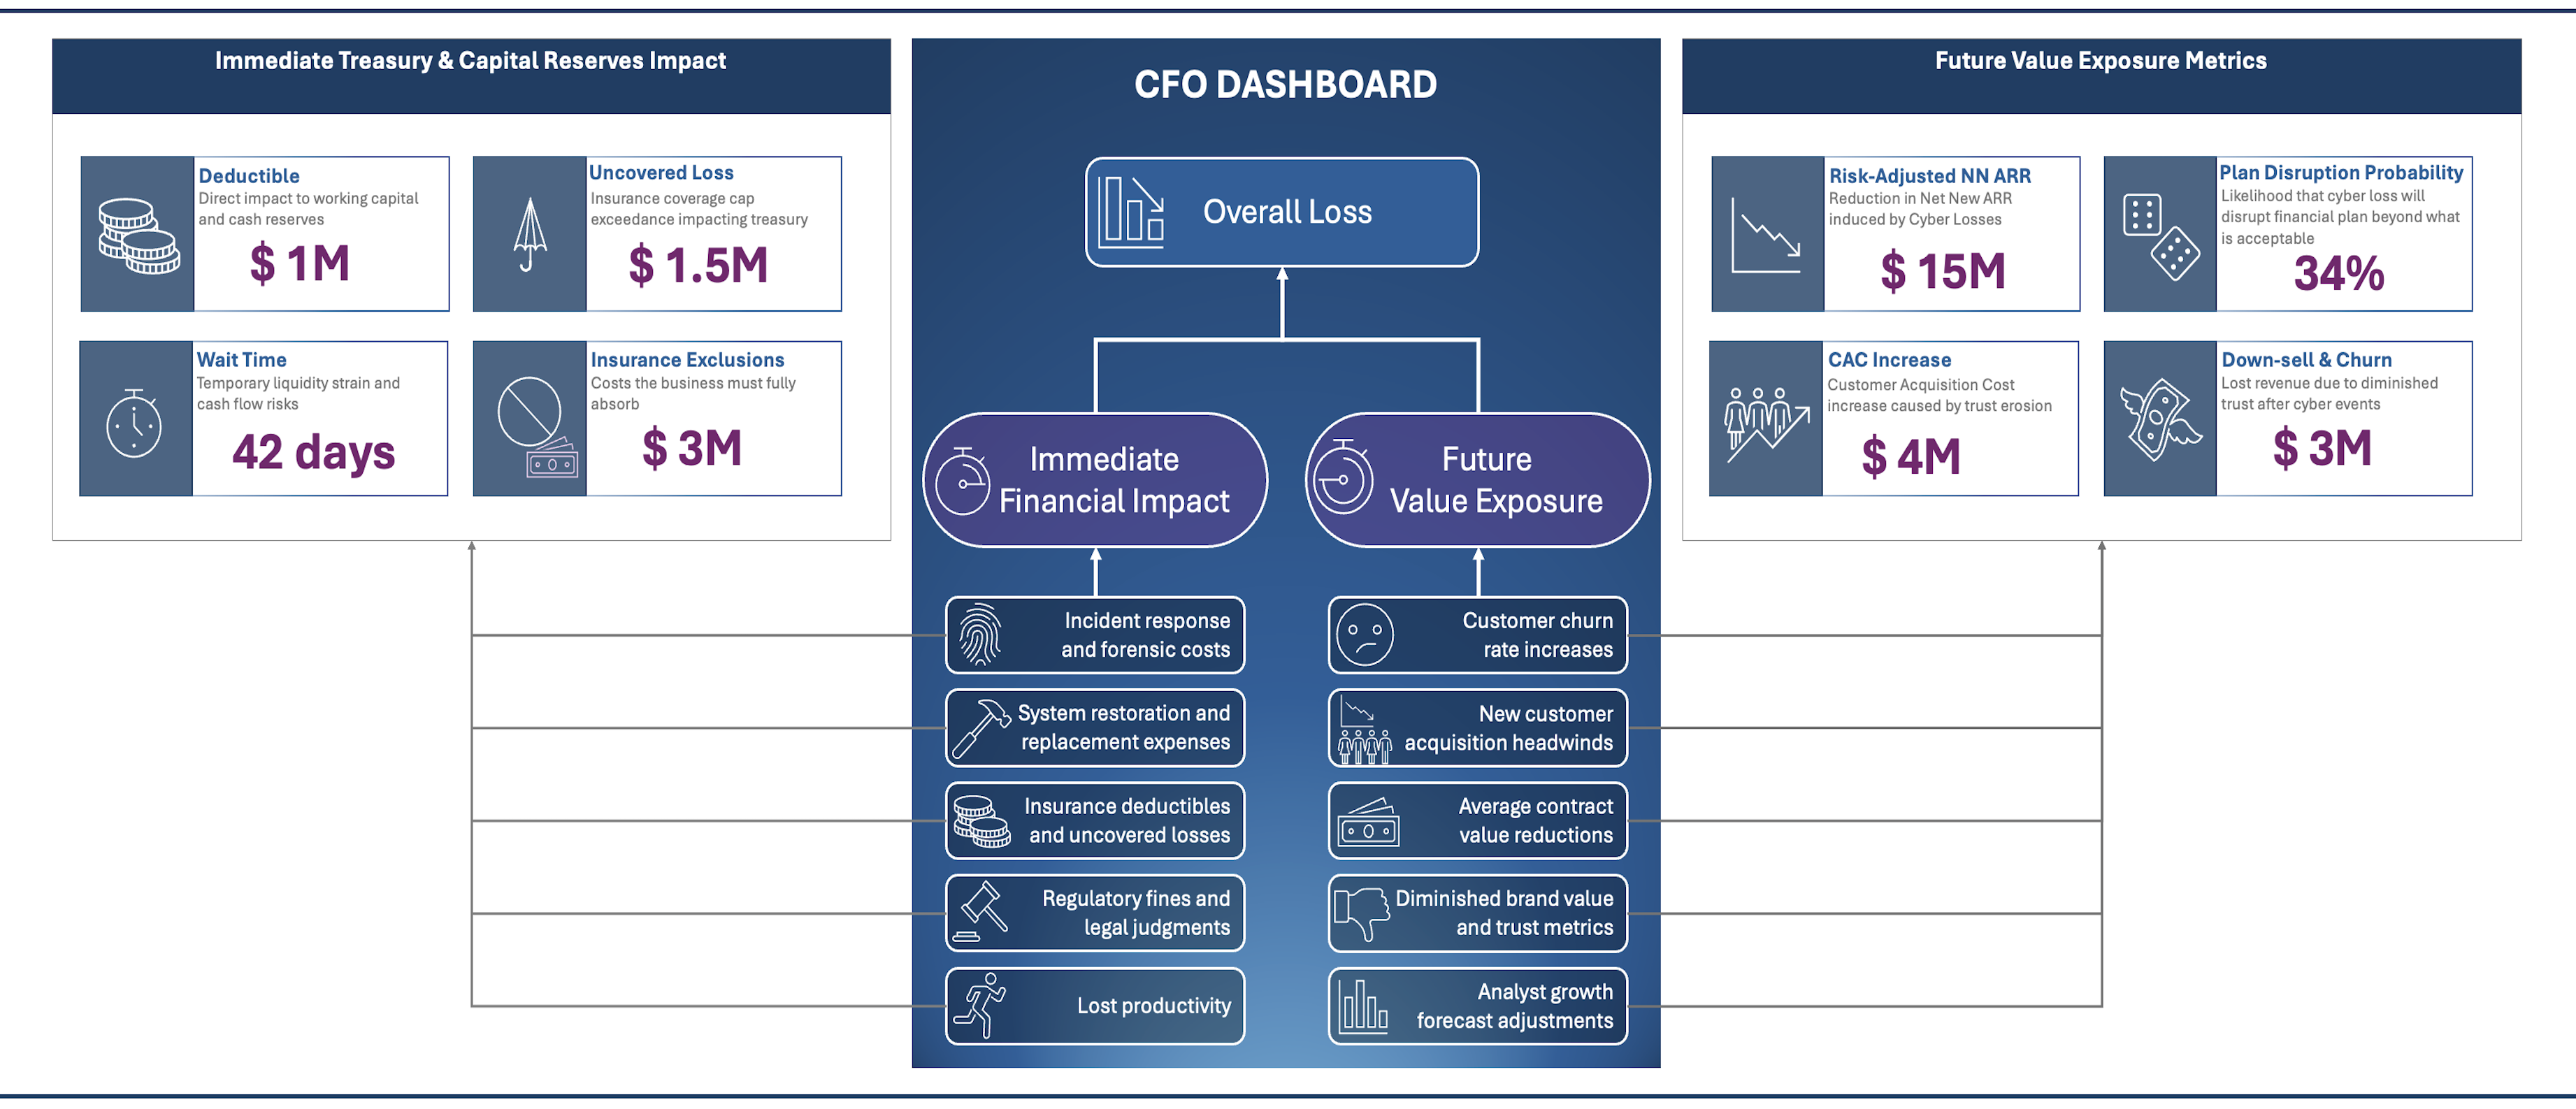
Modeling Immediate Financial Impact and Future Value Exposure

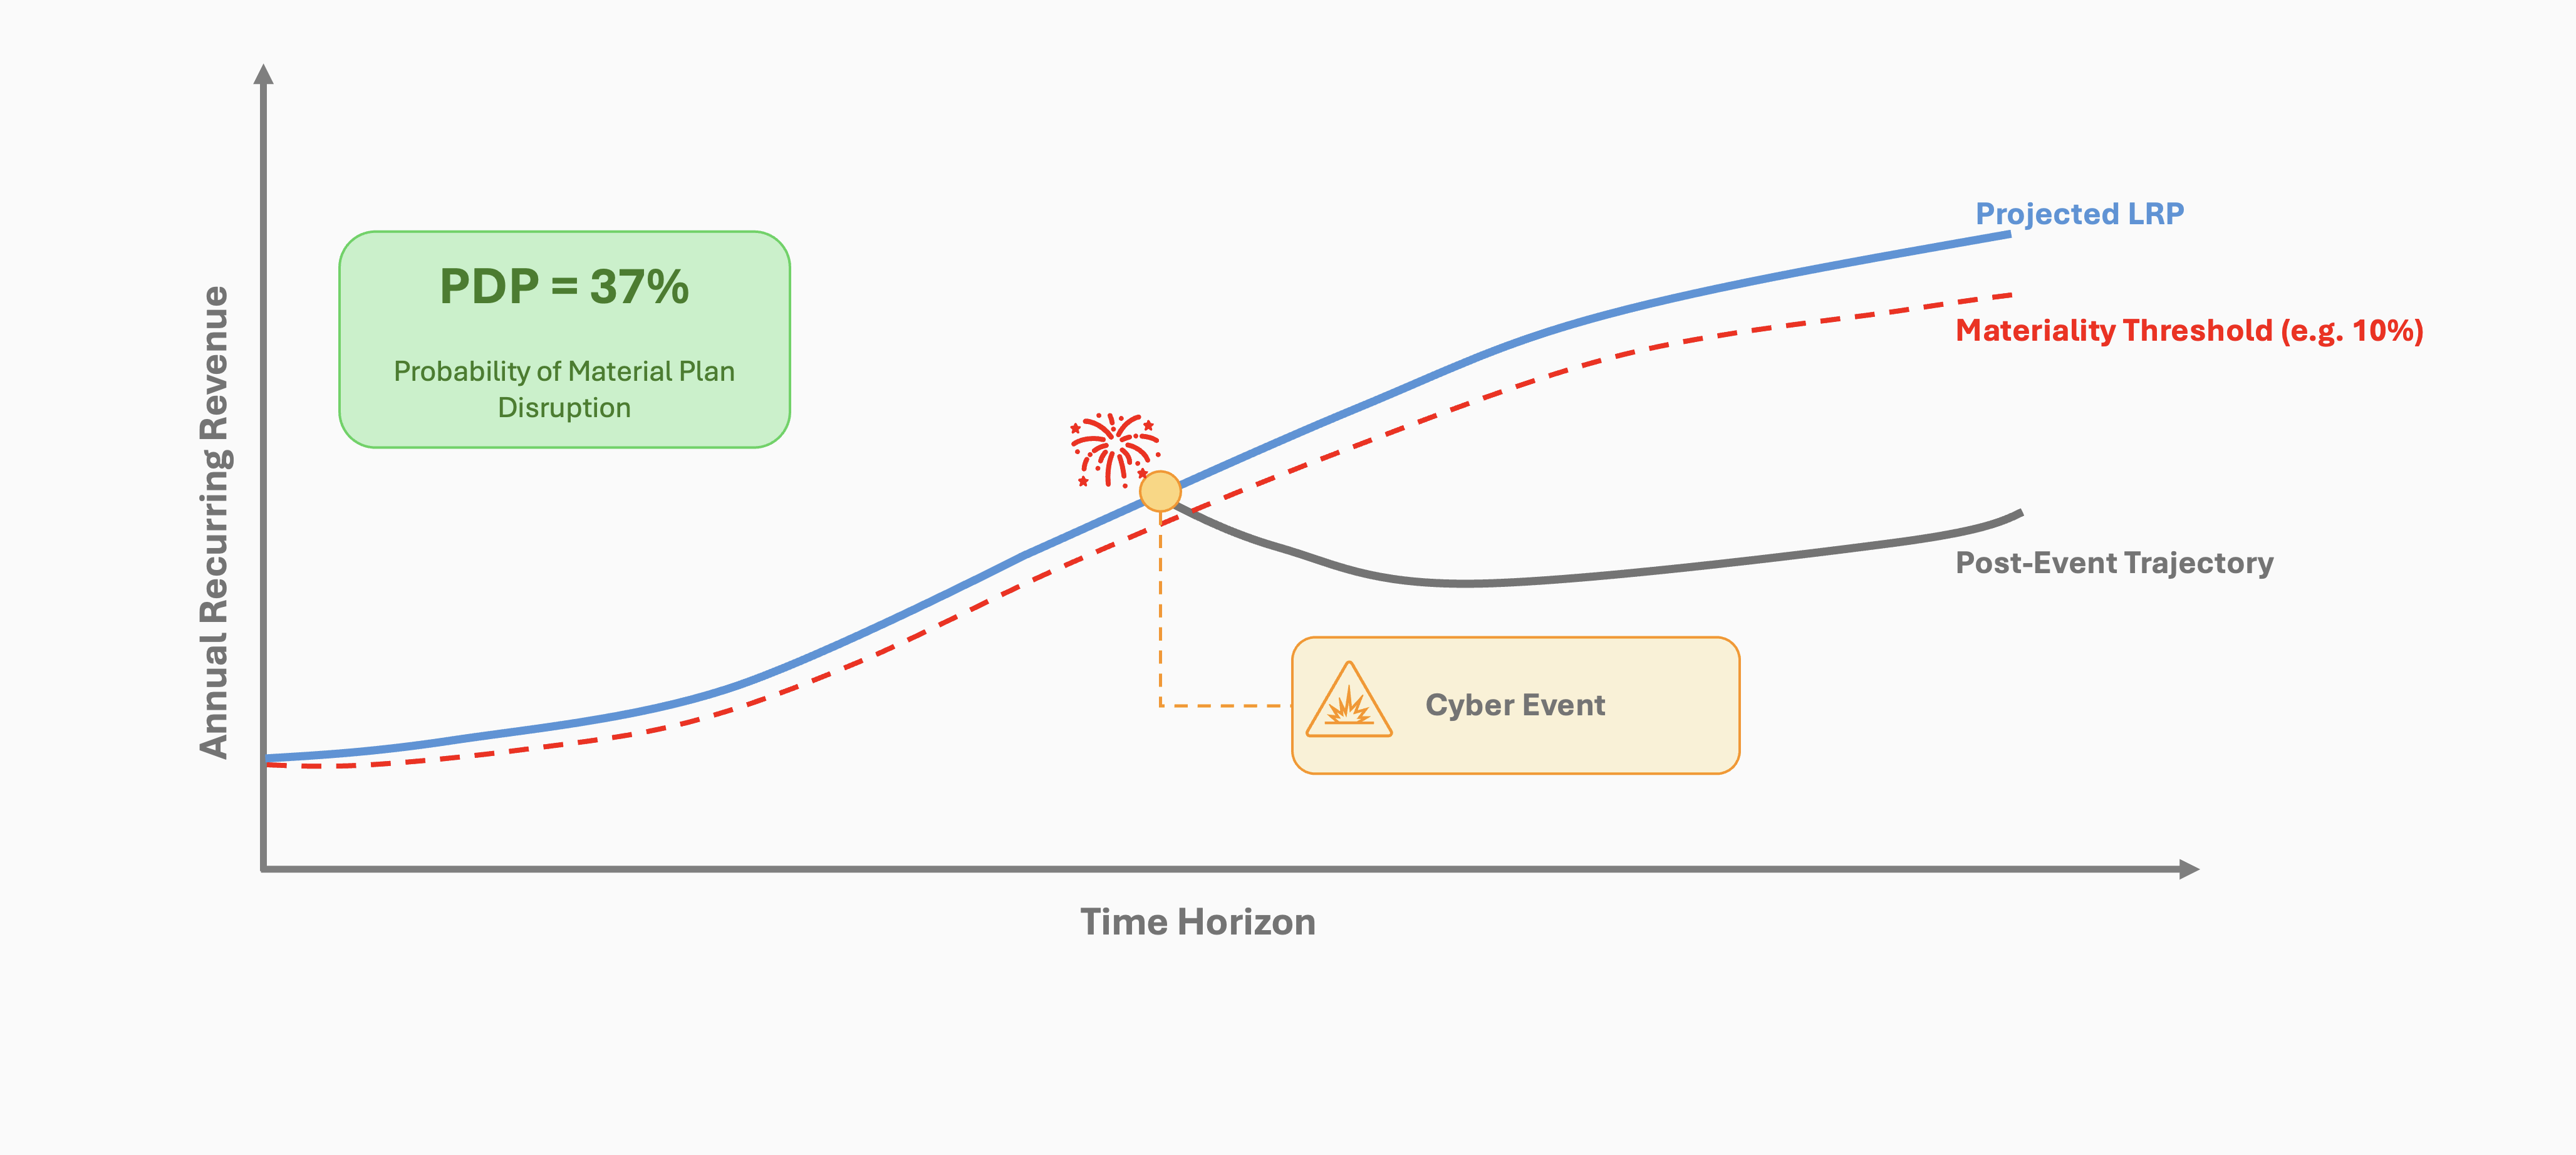
This two-phase model simulates cyber loss across two time horizons. For Immediate Financial Impact, we model insurance deductibles, payout delays, and the resulting treasury strain. For Future Value Exposure, we estimate how a material cyber event could suppress Net New ARR through customer churn and sales slowdown - and how that impacts your Plan Disruption Probability (PDP).

Together, these simulations give CFOs a full-spectrum financial view of cyber risk - critical for liquidity planning, insurance strategy, and safeguarding growth forecasts.

CFO Dashboard
Financial Exposure from Material Cyber Events
Immediate Financial Impact
Deductible Exceedance Risk
Probability that cyber losses exceed the insurance deductible (1.0M)
72%
finance
Capital Reserve Risk
Chance that losses exceed treasury (2.0M) and impact capital reserves
29%
high-risk
Coverage Limit Exceeded
Probability that losses exceed insurance coverage limits (10.0M).
18%
Disruptive Outage Probability
Probability of a cyber loss involving disruptive outage
50%
Recovery Tolerance Exceeded
Probability that outage will exceed recovery tolerance (5 hrs)
9%
time-period
Median Wait Time
Median time before insurance pays. Affects short-term cash flow
4.0 days
Future Value Exposure
Risk-Adjusted New Revenue (Low)
95% chance of exceeding this Net New ARR after accounting for cyber risk.
52.9M
Risk-Adjusted New Revenue (Base)
50% chance of exceeding this Net New ARR under risk-adjusted conditions.
90.2M
Risk-Adjusted New Revenue (High)
5% chance of exceeding this optimistic Net New ARR after cyber loss impact.
151.4M
strategist
Plan Disruption Probability (PDP)
Chance that cyber-related losses will reduce performance below the CFO’s financial plan threshold.
54%
This dashboard summarizes the modeled short- and long-term financial exposure from cyber risk. It is based on a Monte Carlo simulation of 10,000 annual scenarios, incorporating insurance structure, treasury buffer, and cyber loss dynamics.
Executive-Level Metrics
stock-market
Plan Disruption Probability (PDP)
The likelihood that cyber loss will disrupt the financial plan beyond the acceptable threshold.
95% Confidence Interval:[53.02% - 54.98%]
Disruption Tolerance
How much percentage reduction in the NN ARR target is acceptable?
Current Tolerance Threshold:
5%
0% (Low)50%100% (High)
Plan Disruption Probability vs Tolerance
Based on cyber loss forecasts and SME input, this chart shows the probability of failing to meet the NN ARR at different tolerance thresholds.
002020404060608080100100Disruption Tolerance (% of NN ARR)0%0%20%20%40%40%60%60%80%80%100%100%Probability of Disruption (%)
Legend
  • Plan Disruption Probability
  • Tolerance Threshold: 5%
Insurance Coverage
Details of insurance deductibles, limits and wait periods.
Deductible
Limit
Maximum amount of loss that can be covered.
Co-Insurance
The percentage of remaining loss (after deductible) the company still has to pay.
20%
0%50%100%
Wait Period (hours)
Time (in hours) below which loss is not covered.
Recovery Delay Period (hours)
Additional delay in claiming or receiving insurance funds, hours after resolution of the incident.
Liquidity and Loss Absorption Strategy
How the organization prepares to absorb cyber losses without disrupting strategic financial plans.
Treasury
Tolerance
Maximum amount of loss that can be absorbed before major disruption.
Recovery Tolerance (hours)
Maximum number of hours the organization can tolerate being offline.
Long-Range Financial Plan (NN ARR)
The CFO's growth forecast for financial performance.
Low
Medium
High
Probability of Achieving NN ARR Goals
50.0M50.0M100.0M100.0M150.0M150.0M200.0M200.0M250.0M250.0MNN ARR Amount Achieved0%0%20%20%40%40%60%60%80%80%100%100%Exceedance Probability (%)
Legend
  • LRP Exceedance Probability
  • Risk-Adjusted LRP
This graph shows the likelihood of exceeding various NN ARR targets using a log-normal forecast model.
Annual Cyber Loss Forecast
Aggregated view of cyber risk impact over a year.
Average Loss
Extreme Loss (1% Tail)
Loss amount with a 1% chance of being exceeded annually.
Likelihood of a loss event occuring
100%
0% (Low)50% (Moderate)100% (High)
Outage Duration Model
A model of outage scenarios conditional on a loss event.
Average Outage Duration (hours)
Extreme Outage Duration (1% Tail)
Disruptive outage (hours) with a 1% chance of being exceeded annually.
Likelihood of an outage event occuring
Conditional on a loss event.
50%
0% (Low)50% (Moderate)100% (High)
Probability of Exceeding a Given Annual Cyber Loss.
100.0M100.0M200.0M200.0M300.0M300.0M400.0M400.0MCyber Loss Amount0%0%20%20%40%40%60%60%80%80%100%100%Exceedance Probability (%)
Legend
  • Loss Exceedance Probability
This graph shows the likelihood of different cyber loss amounts being exceeded in a year.
SME Impact Estimates on Financial Plan (NN ARR)
Expert assessment of how different levels of cyber loss affect NN ARR performance.
5th Percentile Loss: 185K
If a cyber loss of 185K occurs, how much could it impact the NN ARR?
Estimated NN ARR Impact (%):
Confidence Level
50%
0% (Low)50% (Moderate)100% (High)
Probability distribution of NN ARR impact based on confidence level.
55Impact on NN ARR (%)0.000.000.200.20Probability Density
50th Percentile Loss: 2.5M
If a cyber loss of 2.5M occurs, how much could it impact the NN ARR?
Estimated NN ARR Impact (%):
Confidence Level
50%
0% (Low)50% (Moderate)100% (High)
Probability distribution of NN ARR impact based on confidence level.
1010Impact on NN ARR (%)0.000.000.100.10Probability Density
99th Percentile Loss: 102.1M
If a cyber loss of 102.1M occurs, how much could it impact the NN ARR?
Estimated NN ARR Impact (%):
Confidence Level
50%
0% (Low)50% (Moderate)100% (High)
Probability distribution of NN ARR impact based on confidence level.
2020Impact on NN ARR (%)0.000.000.050.05Probability Density

Board Talking Points for CISOs

Cyber risk plays out financially - first on cash flow, then on customer loyalty and market confidence.

Even with insurance, we face $X M in near-term funding needs. This is a liquidity planning issue.

Modeling shows that a $5 M hit to revenue leads to a $6M drop in enterprise value at our current multiple.

We can prioritize security investments that reduce both immediate cost and future erosion.

CISO Takeaways

  • Communicate cyber in financial terms, not just technical terms
  • Use Monte Carlo to simulate full-range outcomes
  • Break losses into time-phased components
  • Tie mitigation to business value protection

Closing: Speak the CFO’s Language, Influence the Business

Cybersecurity isn’t just a technical function - it’s a business enabler. When CISOs express cyber risk in the language of treasury, growth, and enterprise value, they earn a seat at the strategy table.

This two-phase model empowers you to frame cyber threats as financial risks to be managed, not just technical problems to be solved.

The dashboard above gives CFOs and boards a forward-looking view of cyber risk: not as an IT issue, but as a financial planning variable.

The result? Smarter planning. Better decisions. Stronger resilience.

Back to Blog

Related Posts

View All Posts »
Plan Disruption Probability (PDP):

Plan Disruption Probability (PDP): A CISO’s Guide to Linking Cyber Risk to Business Strategy.

Cybersecurity isn’t just about stopping attacks - it’s about safeguarding the company’s ability to execute its long-range financial plan. Enter Plan Disruption Probability (PDP), a metric that quantifies the likelihood of cyber-induced losses materially derailing financial targets. By measuring PDP, organizations can proactively manage risk within appetite and ensure business resilience.