· Dayo Adetoye (PhD, C|CISO) · Managing Uncertainty and Complexity · 11 min read
The Great Security Bluff:
Why Your Controls Might Fail When You Need Them Most
Can you be confident whether your security controls are battle-ready for a real-world test against threat actors? Are you betting the house on a control that you last tested during last year's audit? This blog post provides some critical analyses and strategies for gaining assurance that your controls will withstand contact against adversaries.

Introduction
In the relentless battle against cyber threats, the resilience of your security controls could mean the difference between a near-miss and a catastrophic breach. Yet, how often do we ask ourselves: are our controls truly ready to withstand an adversary’s test? It’s easy to place trust in measures that passed last year’s audit or met compliance standards, but the real question is whether they can hold up in the chaotic, high-pressure reality of a live attack.
The cybersecurity landscape is anything but static. On the one hand. threat actors constantly evolve their tactics, probing for weaknesses in even the most robust defenses. Meanwhile, on the other hand, your organization’s technical environment is constantly evolving as you add, configure, and manage assets within your infrastructure which may expose unforeseen weaknesses through misconfiguration, human error and unexpected interactions between systems and controls. Is the architecture that you have in your network diagram actually the true picture of your technical environment?
Organizations often overestimate the strength of their safeguards, blinded by assumptions or outdated testing methods. This gap between theoretical security and operational readiness leaves businesses vulnerable — right when they need their controls to perform most.
Assurance through Continuous Validation
At the heart of all these lies the need for continuous validation — a systematic approach to testing and measuring the effectiveness of your controls. This blog introduces a framework for gaining assurance through rigorous analysis and simulation. By calculating the Threat Mitigation Potential of individual controls, we can quantify their ability to protect against specific threats.
Introducing Threat Mitigation Potential (TMP)
At the heart of any effective cybersecurity strategy lies a critical question: How well do your controls mitigate threats in the real world? While compliance and audit results can provide some assurance, they often fall short of revealing how well controls perform under actual attack conditions.
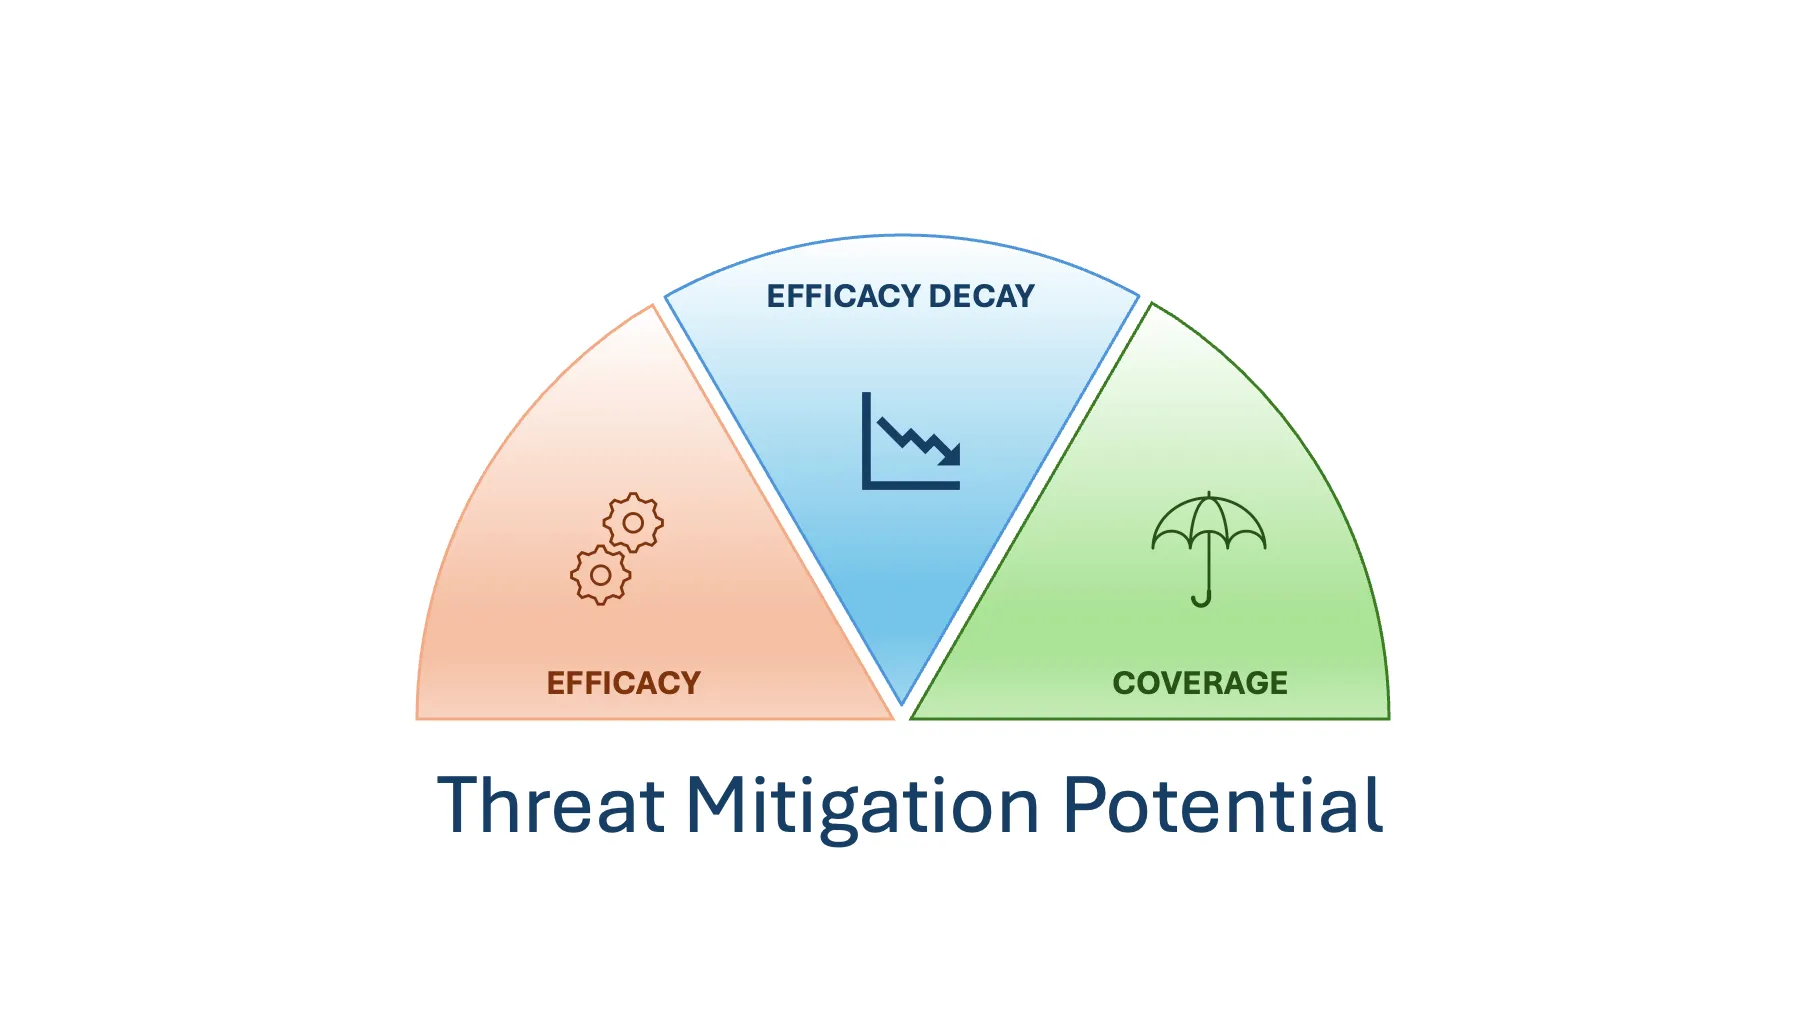
To address this gap, we introduce the concept of Threat Mitigation Potential (TMP)—a comprehensive model designed to quantify the real-world effectiveness of a security control. TMP provides a structured way to evaluate a control’s ability to reduce risk, accounting for three pivotal factors:
- Mitigation Effectiveness (Efficacy): The probability, expressed as a percentage, that the control successfully performs its intended function. For example, an antivirus might block malware 85% of the time, or a firewall might intercept 90% of malicious traffic.
- Efficacy Decay: Decline in the degree of confidence that the control continues to function as expected over time. This factor introduces a dynamic element, modeled using an exponential decay function to reflect the natural reduction in confidence as time passes without rigorous testing or validation.
- Deployment Coverage (Coverage): The extent, also expressed as a percentage, to which the control is deployed across relevant assets. A control that’s only applied to 50% of your systems leaves significant gaps in your defenses.
TMP combines these factors into a practical framework, enabling you to measure the true performance of your controls. It highlights strengths, uncovers blind spots, and provides actionable insights to prioritize and optimize your defenses.
In the sections ahead, we’ll explore how TMP provides a rigorous framework for evaluating your controls’ ability to mitigate threats, ensuring you have a solid foundation to continuously strengthen your defensive security posture.
Control Efficacy Decay
Security controls can fail for a variety of reasons: misconfigurations, outdated detection signatures, conflicts with other controls, or unforeseen changes in the environment. To ensure a control remains effective when it’s needed most, continuous testing and validation are essential. Without this, confidence in a control’s ability to meet its threat mitigation objectives diminishes over time.
We represent the decline in confidence using an exponential decay function, which models the effect of time (in days) on a control’s efficacy. The decay function is defined as follows:
Where:
- : is the efficacy decay rate parameter, which reflects the rate at which confidence in the control’s effectiveness diminishes. A higher indicates faster decay, suitable for more critical controls where risks associated with failure are higher. Conversely, a lower implies slower decay and is suitable for less critical controls.
The graph below illustrates control efficacy decay over time with an example value of :
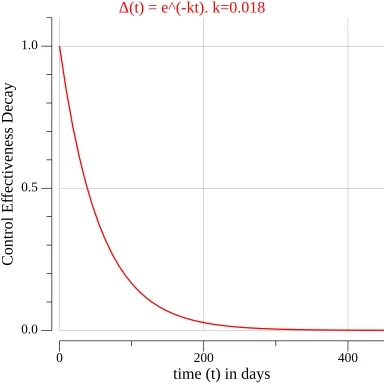
This model provides a straightforward yet powerful way to quantify the importance of continuous validation. The longer a control remains untested, the less certainty there is about its ability to perform as intended. This decline underscores the need to integrate regular testing into your security operations to maintain confidence in your defenses.
Continuous Validation and Efficacy Decay
Testing a control to ensure it functions as expected provides reassurance and resets our confidence in the control’s effectiveness back to its initial value. This process of continuous validation helps counteract the natural decline in confidence over time, effectively “refreshing” the control’s efficacy.
We model this behavior with the following function: suppose represents the interval (in days) between tests. The adjusted efficacy decay, , accounts for these validation intervals and is defined as:
Where:
- : validation cadence of the control, in days.
- : time elapsed, in days.
- : the efficacy decay rate parameter, which reflects the rate at which confidence in the control’s effectiveness diminishes.
The modulus operation () resets the decay whenever validation occurs at interval .
The graphs below illustrate how regular validation impacts the control’s efficacy decay, highlighting the importance of consistent testing to sustain confidence in your security controls.
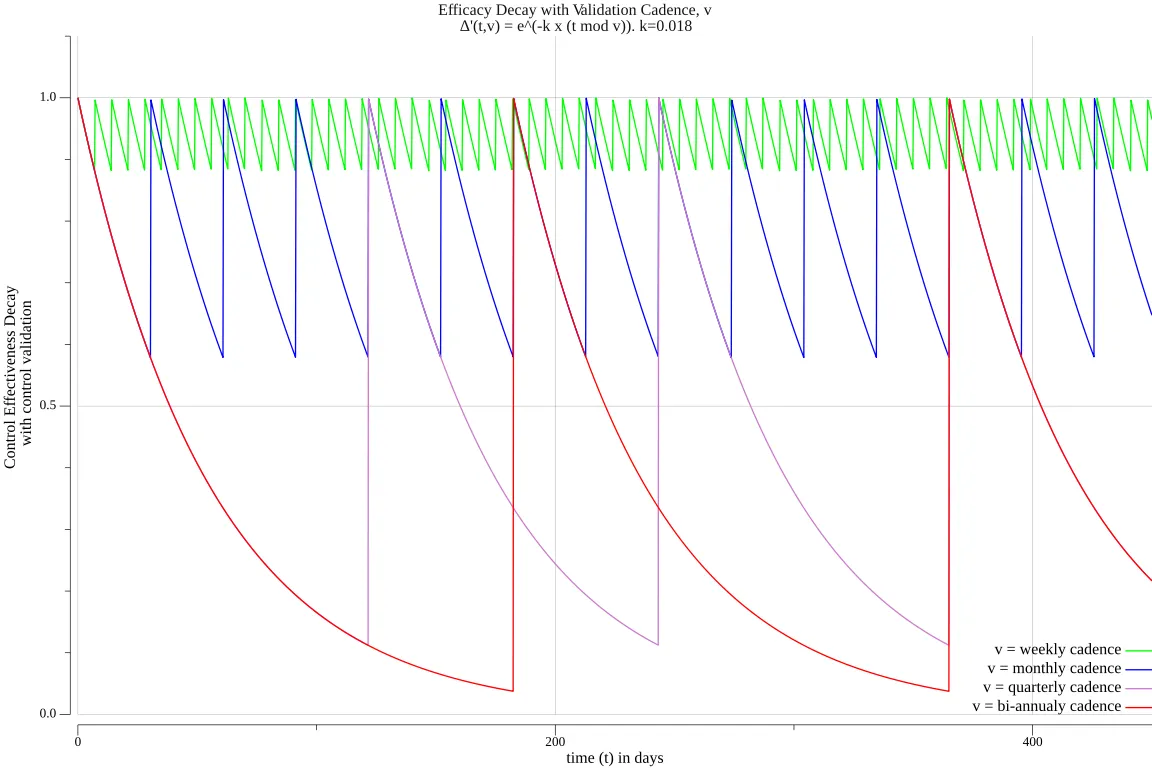
As shown in the graph, a weekly validation cadence ensures that efficacy decay rarely drops below 90%, whereas a bi-annual cadence allows confidence to diminish to nearly 0% before the next test. This highlights the critical role of testing frequency, represented by , in sustaining an effective and reliable defensive posture.
Simulating Threat Mitigation
With an efficacy measure in place, we can use a Monte Carlo simulation to evaluate how effectively a control mitigates threats over time.
The simulation is governed by the following rule:
Here’s what each parameter represents:
- : The outcome of a single experiment, indicating whether the threat was mitigated or not.
- : A random number drawn from a uniform distribution (0, 1).
- : The simulated day when the threat event occurs.
- : The validation cadence of the control.
In this model, the control mitigates the threat if its mitigation potential—calculated as the product of Efficacy, (decayed efficacy), and Coverage—exceeds the random number . We repeat this process over many iterations to determine how often the control successfully mitigates threats versus when it fails.
By aggregating the results, we can calculate the Threat Mitigation Potential (TMP) of the control, providing a quantifiable measure of its effectiveness in real-world scenarios.
Deriving Threat Mitigation Potential
Instead of approximating the Threat Mitigation Potential (TMP) through thousands of Monte Carlo simulations, we can derive it analytically (details provided in the drop-down below). The formula for TMP is as follows:
Where:
- Efficacy: The probability, expressed as a percentage, that the control successfully performs its intended function.
- Coverage: The extent, also expressed as a percentage, to which the control is deployed across relevant assets.
- : The validation cadence of the control.
- : the efficacy decay rate parameter, which reflects the rate at which confidence in the control’s effectiveness diminishes.
This formula provides an exact calculation of TMP, incorporating the effects of control efficacy, validation cadence, and deployment coverage into a single metric. By directly computing TMP, organizations can better understand and quantify the real-world impact of their security controls.
By recognizing that is a continuous function of and that is uniformly distributed, we can simplify the calculation. For a constant validation cadence , the function forms a repeating cycle. Therefore, the expected value of as is the same as its expected value over one interval .
Within this interval, . The expected value of over can be derived as follows:
Since in the simulation is uniformly distributed, the probability that the control mitigates a threat is given by:
Applying Threat Mitigation Potential in Practice
Let’s explore a couple of examples to illustrate how TMP can guide practical security decisions while aligning controls with an organization’s risk tolerance.
Example 1: How Often Should We Validate Our Anti-Phishing Control?
Imagine a control designed to prevent phishing attacks by analyzing email content and blocking suspicious messages. Its parameters are:
- Efficacy: The control successfully blocks phishing attempts 85% of the time when functioning as intended.
- Coverage: The control is deployed across 80% of the organization’s email systems.
- Validation Cadence: The control is tested monthly, so days.
- Decay Rate (): The efficacy decay parameter is set to 0.02, reflecting a moderate decline in confidence without validation.
- Risk Tolerance Threshold: The organization requires controls to maintain at least a 70% TMP to meet its risk appetite.
Using the TMP formula:
Substituting the values:
After solving:
The result, 51% TMP, indicates that the control’s current configuration is insufficient to meet the organization’s risk tolerance of 70%.
Improving TMP
Increase Validation Cadence: Testing the control weekly ( days) instead of monthly yields:
Solving gives:
The TMP increases to 63%, narrowing the gap to the 70% threshold but still falling short.
Increase Coverage: Deploying the control across 95% of email systems raises the original TMP to:
Combined Approach: Testing weekly and increasing coverage to 95% achieves:
With these combined improvements, the control now meets the 70% TMP requirement, aligning it with the organization’s risk tolerance.
Example 2: Is Our Perimeter Firewall Meeting Risk Tolerance Goals?
A perimeter firewall designed to block malicious network traffic has the following characteristics:
- Efficacy: The firewall blocks malicious traffic 90% of the time when functioning as intended.
- Coverage: The firewall protects 70% of the organization’s critical assets.
- Validation Cadence: The firewall is tested quarterly, so days.
- Decay Rate (): The efficacy decay parameter is set to 0.015, reflecting a conservative decline in confidence without validation.
- Risk Tolerance Threshold: Critical controls must maintain at least a 75% TMP to align with the organization’s risk appetite.
Using the TMP formula:
Substituting the values:
After solving:
The result, 35% TMP, is well below the required 75%.
Improving TMP
Increase Validation Cadence: Testing monthly ( days) gives:
Increase Coverage: Expanding the firewall to protect 90% of assets raises the original TMP to:
Combined Approach: Monthly testing and 90% coverage achieves:
Aggressive Weekly Validation: Testing weekly with 90% coverage achieves:
This approach finally aligns the control with the risk appetite, demonstrating how aggressive testing and broader deployment can meet organizational risk tolerance goals.
Decision Support
These examples demonstrate how TMP enables organizations to:
- Quantify Control Effectiveness: TMP translates security control performance into actionable insights that align with risk management objectives.
- Optimize Resource Allocation: TMP helps identify where to invest in increased validation or coverage to maximize risk mitigation.
- Balance Risk and Cost: TMP offers a data-driven foundation for weighing operational costs (e.g., testing frequency) against the benefits of improved risk mitigation.
Conclusion
The Threat Mitigation Potential (TMP) framework provides a structured and quantitative approach to assess and improve the real-world performance of security controls. By incorporating efficacy, coverage, and validation cadence into a single metric, TMP transforms abstract risk discussions into actionable decision-making tools.
These examples illustrate how organizations can apply TMP to evaluate whether their controls align with risk tolerance thresholds and explore strategies for improvement. Continuous validation emerges as a key enabler, reinforcing the importance of proactive testing and deployment in maintaining an effective security posture.
In today’s dynamic threat environment, where the stakes are high and adversaries relentless, TMP equips decision-makers with the confidence and clarity needed to ensure controls are ready to defend when it matters most. Start incorporating TMP into your risk management practices today and position your organization for a resilient tomorrow.


