· Dayo Adetoye (PhD, C|CISO) · Partnering with the Business · 14 min read
The Probability Behind the Finding:
Calibrated Exploit Estimates Beyond CVEs
CVSS severity is not exploit probability. EPSS proved that prioritizing by real-world abuse probability delivers 12x better prioritization precision than chasing CVSS 9.8 scores. But EPSS has a fatal structural limit: it only works on CVEs. Secrets in code, over-permissioned service accounts, and dependencies without published advisories sit in the dark with zero math behind them. Here is the principled 3-layer framework to calculate calibrated exploit probabilities for every non-CVE weakness on your risk register.
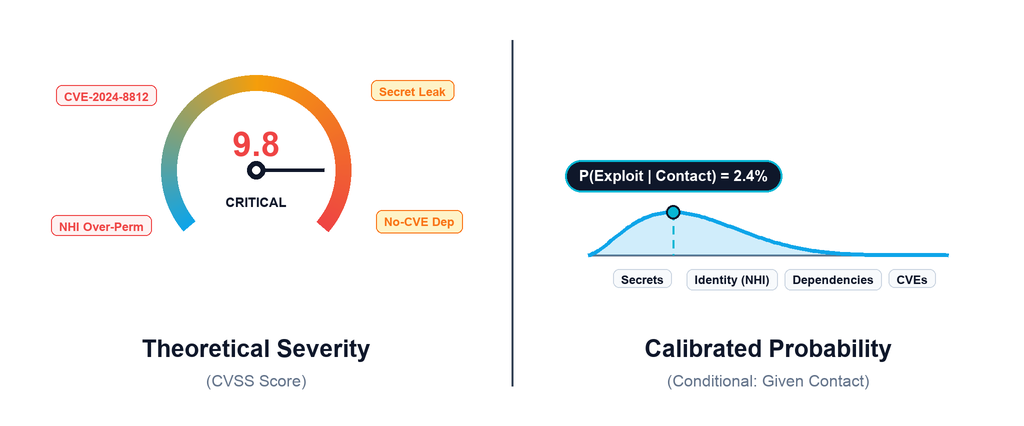
Risk quantification, remediation prioritization, and credible communication to the business all require a number that severity scores cannot provide: the probability that a specific weakness in your environment gets exploited within a relevant time window. The Exploit Prediction Scoring System (EPSS) showed that calibrated exploitation probabilities outperform severity-based prioritization by a factor of twelve in prioritization precision. EPSS is the right model. Its scope is the constraint.
EPSS is trained on vulnerabilities in the Common Vulnerabilities and Exposures (CVE) catalog. Production secrets committed to code, over-permissioned non-human identities, exposed data stores, and vulnerable dependencies without a published advisory sit outside its scope. These weaknesses appear in every risk register. None has a principled exploitation probability. Without one, susceptibility scoring is incomplete, remediation queues fall back to gut feel, and the business case to engineering lacks a number that can be challenged and revised.
This post generalizes EPSS’s core insight (observable weakness features predict exploitation probability) to any weakness class. A three-layer method uses published abuse research as a calibrated starting point, instance-specific adjustments mirroring the signal categories EPSS v3 identified as predictive (exploit code availability, CISA KEV listing, network accessibility, and privilege requirements), and Bayesian updates from your own environment’s telemetry. For weaknesses with a CVE, EPSS integrates directly at the attempt stage. The output is a probability range that feeds susceptibility scoring, supports defensible remediation decisions, and gives the business a number it can challenge and revise.
In This Post
The collapsed guides along the way hold the reproduce-it-yourself mathematical details and update mechanics.
The Problem with Severity as a Stand-In
I’ve watched security teams fill exploit probability with severity scores or gut feel. The Common Vulnerability Scoring System (CVSS) rates how bad a vulnerability is in theory: memory corruption, unauthenticated access, network reachability. EPSS rates how likely one is to be exploited in practice. EPSS v3 (Jacobs et al., 2023) measured the gap empirically: CVSS-based prioritization achieved 3.9% precision at 82% coverage, barely above the ~3.7% base rate of random selection. EPSS achieves the same 80% threat coverage at roughly one-eighth the remediation effort. EPSS fixed the problem for vulnerabilities with registered identifiers, specifically CVE entries.
The gap it left: most weaknesses in a modern risk register carry no CVE entry. Secrets committed to code, over-permissioned non-human identities (NHIs: service accounts, API keys, and bot credentials that software uses to act on its own), exposed data stores, dependencies without published advisories: none of these have an EPSS score. Teams fall back to severity or intuition, which overloads the top of the remediation queue with findings that may never be selected or attempted. The queue looks urgent. The prioritization behind it is not.
What EPSS Proved
Two lessons from EPSS transfer to any weakness class, CVE or not.
The first lesson is definitional. A calibrated probability of observed abuse within a defender-relevant time window beats a severity score by design, because it measures what attackers actually do rather than what a vulnerability theoretically enables. The 30-day window was chosen to match patch cycle decision horizons. For non-CVE weaknesses, the honest window is the attacker’s timeline, not yours. AI-accelerated discovery and weaponization have compressed exploitation from weeks to hours for internet-exposed assets: honeytoken research already showed near-certain secret exploitation within hours of public exposure, and that baseline has tightened. Set the estimation window to reflect the realistic threat timeline for each class: hours for internet-facing secrets and exposed credentials, days for weaknesses with public exploitation tooling, weeks for internal or isolated assets. Use your rotation or review cadence as the remediation target; the gap between that and your estimation window is the risk you are carrying.
The second lesson is empirical. Variable-importance analysis of EPSS v3 using SHAP values (Jacobs et al., 2023) demonstrates that published exploit code (in frameworks such as Exploit-DB, Metasploit, or GitHub) is the strongest overall feature class contributing to estimated exploitation probability, followed by threat-intelligence listings (CISA KEV, ZDI) and CVSS exploitability metrics (specifically network reachability AV:N and unauthenticated access PR:N). Attackers route to weaknesses with available exploit code and low access complexity, not those with the highest theoretical severity scores. Both lessons apply regardless of CVE status.
Why EPSS Cannot Generalize
The trained model requires what only CVE identifiers supply: a shared label that lets hundreds of organizations contribute their detections to one common dataset. EPSS v3 trained on 6.4 million exploitation observations against 12,243 unique CVEs. That dataset exists because CVE-2021-44228 (the Log4Shell vulnerability) is the same finding at every organization, so detections from different companies can be combined.
Non-CVE weaknesses are instances, not categories. My leaked credential is not your leaked credential. There is no shared identifier, no common dataset to train on, and no statistical model to run at scale. This is structural. No amount of tooling patches a missing shared label.
The raw material exists in fragments: honeytoken studies supply abuse base rates for secrets, the Verizon Data Breach Investigations Report (DBIR) tracks credential-action frequencies, reachability analyses bound dependency exposure. Commercial risk platforms layer these signals onto EPSS as contextual adjustments but stay CVE-anchored for exploitation probability itself. No published framework assembles class-level priors, instance modifiers, and a telemetry update path into a unified exploitation-probability estimate for non-CVE weakness classes. The three layers below are an attempt at that.
A Three-Layer Estimate
Three layers replace what EPSS cannot provide. The combined output of the three stages (Applicability, Attempt, Success) is : a conditional probability given that an attacker has already reached the asset. Contact probability (the likelihood an attacker reaches the asset at all) is assessed separately from network exposure and attack-surface analysis and is not part of this framework. For internet-facing assets, contact approaches certainty and the conditional estimate is close to the unconditional one; for internal or isolated assets, multiply by your contact probability to get the unconditional exploitation probability.
Stage Decomposition Equation:
- Applicability (): Is the weakness active, reachable, and loaded in the target execution environment?
- Attempt (): Given an applicable weakness, will an attacker select and target it within the time window?
- Success (): Given an attempt, will local security controls and defensive posture fail to prevent execution?
Logit-Space Adjustments: Adjustments operate on the log-odds (logit) scale: . Each step of multiplies or divides the odds by (roughly a factor of three). Operating in logit space guarantees probabilities remain strictly bounded between 0 and 1, preventing the mathematical absurdities of linear addition.
Layer 3 Beta-Binomial Conjugate Update: Where is observed attempts or successes out of opportunities, weighted by telemetry reliability .
Layer 1: starting estimates from published abuse research. For secrets: honeytoken research (studies using fake credentials that trigger alerts when used) reports near-certain attempted use for public leaks within hours; GitGuardian’s annual sprawl data gives the share of discovered secrets that remain valid. For NHIs: the DBIR supplies credential-abuse frequencies. For vulnerable dependencies: Datadog and Snyk reachability analyses establish the share that are actually loaded on the code paths that handle requests.
Each starting estimate is expressed as a probability distribution (technically a Beta distribution) that captures our uncertainty as a range with a center of gravity. It carries deliberately limited weight, set to four to twelve effective observations, because a study of public GitHub leaks does not apply directly to a private repository without a discount. That discount lives in the weight: “this starting estimate is worth about six local observations” means a few months of real telemetry can substantially move it.
Layer 2: instance adjustments. Instances within a category differ in ways the category-level estimate cannot see. A production database credential is not a test-environment key. A clearly labeled secret on the live branch of a repository is not one buried in old commit history. Mirroring the signal categories EPSS v3 found predictive (exploit code availability, CISA KEV listing, network accessibility, and privilege requirements), each weakness category carries a short adjustment catalog: named, directional, bounded shifts applied to the probability estimate. Each step of multiplies or divides the odds by roughly three; adjustments are capped at per stage. Each adjustment moves only the probability, not the uncertainty width, so revisions are cheap.
| Category | Stage | Adjustment | Signal type | Direction and weight |
|---|---|---|---|---|
| Secret | Applicability | Not rotated in > 1 year | Ease | +0.5 |
| Secret | Attempt | Clearly labeled on the live branch (vs buried in history) | Ease | +1.0 |
| Secret | Attempt | History-only, obfuscated naming | Ease | −1.0 |
| Secret | Success | Endpoint reachable only from inside the network | Ease | −1.0 |
| NHI | Applicability | Long-lived reusable key, age > 1 year | Ease | +0.5 |
| NHI | Attempt | Key visible in build-pipeline logs | Attention | +1.0 |
| NHI | Success | Allowlist restricts which IPs can call the API | Ease | −1.0 |
| Dependency | Applicability | Library on the code path that handles requests | Ease | +1.0 |
| Dependency | Attempt | Exploitation-intelligence signal (see table below) | Attention | −1.0 to +2.0 |
| Dependency | Success | Default configuration is the vulnerable configuration | Ease | +0.5 |
Instance count is itself an input. A secret present across multiple repository locations, build logs, and deployment artifacts expands the attack surface beyond a single file; contact and applicability probabilities should reflect the aggregate count, not a single occurrence. Count instances before setting stage estimates. Remediation scope must cover all instances: removing three of fifteen leaves the route open through the remaining twelve, and uncovered instances belong in a separate residual estimate, not in the remediated state.
Layer 3: updates from your own environment’s data. When a canary credential fires (a dummy credential placed precisely to alert if used), identity-provider logs confirm an authentication attempt, or incident response establishes that an attacker reached the weakness, the relevant stage updates using a Beta-Binomial conjugate update. Evidence is weighted by how closely it reflects the real scenario: actual production telemetry at full weight (1.0), a controlled security exercise on a representative configuration at 0.6, vendor or lab evidence at 0.3. These weights are working heuristics; adjust based on your program’s threat-intelligence maturity. Updates are stage-specific: an observed attempt updates the attempt-stage estimate; a confirmed authentication success updates the success-stage estimate. Contact frequency is evidenced separately and is never inferred from scanner findings.
Where EPSS Fits In
When a vulnerable dependency carries a CVE and an EPSS score, that score represents world-level attacker attention: the probability that exploitation activity for this CVE is observed somewhere in a global sensor network within 30 days. That is not the same as the probability your specific instance is successfully exploited. EPSS’s entry point in this framework is the attempt stage: among attackers who have reached the asset, attention determines how likely they will select and try this particular weakness. It never enters the success stage, because local success depends on the deployed version, configuration, and network position, none of which EPSS knows.
The mapping is a deliberately coarse band, because EPSS measures global activity and we want per-contact selection:
| Signal | Attempt-stage adjustment |
|---|---|
| CVE: EPSS score < 0.01 | −1.0 |
| CVE: EPSS score 0.01–0.10 | 0 |
| CVE: EPSS score 0.10–0.50 | +1.0 |
| CVE: EPSS score > 0.50, or on the US government’s Known Exploited Vulnerabilities (KEV) list | +2.0 |
| No CVE, no proof-of-concept code, tool, or chatter signals | −1.0 |
| No CVE, proof-of-concept code or mass-scan templates available (signals merged) | +1.0 |
| No CVE, active exploitation reported in the wild | +2.0 |
Deduplication Rule: When an EPSS score exists, it already incorporates proof-of-concept availability, tool inclusion, and public chatter as inputs. Adding a separate “Metasploit module exists” adjustment on top would count the same evidence twice.
Attention-Proxy Capping for Non-CVE Weaknesses: For no-CVE weaknesses, attention-proxy signals (proof-of-concept code, tool templates, public chatter) are capped at +1.0: those signals feed EPSS’s trained model, and without a calibrated score to anchor against, a higher adjustment from the same proxies would be speculation. Confirmed in-the-wild exploitation is direct evidence rather than a proxy, and warrants +2.0 for the same reason KEV membership does on the CVE path.
The Evidence Ledger
Every starting estimate, adjustment, and update is one row in a two-part ledger. Part 1 holds starting estimates and applied adjustments with their source, direction, and verification status. Part 2 holds updates with the observation, the count of opportunities it was drawn from, sensor quality, and evidence weight.
Open Mathematics vs. Proprietary Black Boxes
Commercial posture platforms assign proprietary, black-box “risk scores” (0 to 1000) that engineers cannot inspect or challenge. This framework provides a Chain of Custody for risk numbers. When engineering disputes a factor, you can hand them the exact ledger row, remove the challenged modifier, and recompute in one line.
The ledger’s function is not auditability theater. A challenged adjustment can be removed and the estimate recomputed in simple arithmetic, and nothing else in the chain moves. That is what makes it worth engineering’s time. They can dispute a single factor, verify its removal, and see the estimate shift. A model nobody can interrogate earns no trust from the people whose roadmap it is supposed to move.
Calibration Discipline
Every stage estimate carries one of three labels:
- Illustrative: invented for exposition, with no claim to real probability.
- Sourced: traceable to a named, verified study with documented adjustments. The estimate propagates assumptions rather than validated probabilities.
- Calibrated: tested against actual outcomes. Requires at least fifty prediction-outcome pairs (a practical heuristic, not a formal criterion; more observations always improve confidence) and a demonstrated accuracy improvement over the naive baseline of assigning every instance the same category average.
Most starting estimates will carry the sourced label for years. That is honest. Present a sourced estimate as assumption propagation and say so when it feeds a decision.
Reaching the calibrated label requires real outcome data: which instances were actually attempted or exploited, when, and at which stage. Until that data exists, describe what went into the estimate and let the decision-maker weigh the assumptions.
Practical Moves
- Start with the category estimate and enter the obvious adjustments. A sourced estimate with two adjustments is better than a hand-entered range with no documentation: it externalizes the reasoning, makes revision cheap, and signals to engineering that the number has a chain of custody.
- Deploy one canary per weakness category. A single dummy credential confirms the attempt-stage estimate matters. Before that, you are working from the category starting point only, and should say so. After that, you have a real observation from your own environment and the update is worth running.
- Count instances before scoring. A weakness present in many locations carries higher contact and applicability than the same weakness isolated to one. Define the remediation scope against the full instance count and verify coverage before claiming the route closed.
- Rank within the category before mandating fixes. Adjustment application turns “500 secrets, intractable” into “these four carry most of the measurable attempt probability; start here.”
- When EPSS and your intuition disagree on a CVE-registered weakness: trust EPSS. It was validated at scale against millions of real-world exploitation observations. Your intuition was not.
The Prior Estimator
The Prior Estimator below operationalizes the three layers. Select a weakness category, apply the modifiers that describe your specific instance, and read off the probability range for each stage. The combined A × T × S probability is P(exploit | contact): conditioned on an attacker reaching the asset. For isolated or internal-only assets, multiply by your contact probability from attack-surface analysis to get the unconditional estimate. Those ranges are the direct inputs to susceptibility scoring and remediation prioritization.
A × T × S
1 − (1 − p)N
CISO Talking Points
“We have a principled number, not a guess.” Each stage estimate has a named source, a documented adjustment, and a chain of custody. When engineering disputes an estimate, remove the challenged modifier and recompute. Nothing else in the chain moves.
“Severity is not probability.” CVSS measures theoretical severity; EPSS measures global attacker intent; local posture determines whether they succeed. When a risk committee asks why a low-CVSS finding ranks ahead of a critical one, the answer is a calibrated exploitation probability: how likely is this to be selected and attempted against your environment, not how bad it is in theory.
“Our estimates carry honest labels.” Sourced estimates propagate assumptions. Calibrated estimates have been tested against outcomes. Presenting a sourced estimate as “what published evidence suggests, not a validated probability” is more credible than false precision in either direction.
“One canary data point changes the picture.” A single dummy credential that fires upgrades one stage estimate from a category starting point to an observation from your own environment. Before that, you are working from published research. After it, you have real data.
“Instance count is scope.” Declaring a weakness remediated requires knowing how many instances existed. Removing three of fifteen leaves the route open. Remediation coverage and probability estimates must both reflect the full instance count.