· Dayo Adetoye (PhD, C|CISO) · Partnering with the Business · 8 min read
A Backlog Is an Inventory,
Not a Debt.
A security leader invests in better detection. Next quarter, the open-findings count is up, the reported risk number is up, and the board asks why the number got worse right after the team paid for it to get better. Nothing in the environment deteriorated: the instrument got better. This post names the trap, draws the line between a belief correction and a world change, and replaces the metrics (findings discovered, findings closed, mean-time-to-remediate, backlog size) that reward a security program for looking away.
Every CISO carries the same question, regardless of tenure: what exposure am I carrying right now that I don’t know about? The honest answer is always “some.” A new CISO inherits an unmapped estate; a veteran five years in still unearths orphaned subdomains and forgotten service accounts. A risk report that only tracks what has already been found cannot quantify what remains unseen.
A security leader invests in continuous monitoring specifically to shrink that blind spot. Next quarter, open findings rise, reported risk spikes, and the board asks the obvious question: didn’t we just pay for this to get better?
Nothing in the environment deteriorated; the instrument improved. A weakness carried silently under a false all-clear simply stopped being invisible. This is not a footnote caveat: it is the central paradox of security operations. The default metrics programs report today (findings discovered, findings closed, mean-time-to-remediate, backlog size) all deteriorate precisely when a program operates effectively. They actively reward looking away. This post names the trap and replaces the metrics.
In This Post
The Trap: Better Instruments Make the Number Go Up
Split total exposure time into undetected and known periods: . Risk accrues across both, yet traditional risk reports only track . During , the estate is not free of risk; it carries a false-low estimate signed off in ignorance.
Improve detection, and collapses into . Previously silent weaknesses surface, and reported exposure jumps. Nothing in the estate deteriorated: the instrument simply got better.
Incentives instantly align against transparency. The team that instruments aggressively reports higher risk than the team that stays blind. If executive reporting cannot distinguish visibility from vulnerability, the rational organizational move is to stop looking. A risk model that punishes measurement will be gamed, and it deserves to be.
Belief Correction Is Not a World Change
The fix is to decouple the drivers of risk movement and never blend them into a single trend line:
- A world change is physical: a new vulnerability introduced or a control relaxed.
- A belief correction is informational: the same world, better observed.
A belief correction is not a security failure; it is an update to a previously inaccurate report.
Here is the distinction a board can govern: “We discovered what was already there” is one line item. “Our estate physically deteriorated” is another. Conflate the two, and governance loses credibility in a single board meeting.
Master this, and a belief correction ceases to look like bad news. It becomes empirical proof of monitoring ROI: the magnitude of the jump equals the exact magnitude of hidden risk the organization was carrying on a signed-off report.
A sensor that never triggers a belief correction signals one of two realities: either it monitors a static, dead zone of the environment, or it is broken. Either way, the diagnostic is about the sensor, not the estate.
Detection Doesn’t Create Work, It Creates Order
The engineering pushback is understandable. Teams resist scheduled penetration tests or pipeline static analysis not out of skepticism, but because they are drowning in unresolved findings with expired SLAs. Requesting fresh scans atop an uncleared backlog feels less like diligence and more like management piling on.
The emotion is valid; the premise is false. The weakness existed; exposure was already being carried. Detection does not generate work: it generates visibility. Its real output is not a longer queue, but a correctly ordered queue. The choice is never between more work and less work (latent risk is set by the estate, not the sensor), but between rational prioritization and blind backlog traversal at identical cost. Unlimited capacity needs no prioritization; constrained capacity needs it urgently.
The transformative reframe: a finding does not obligate remediation; it obligates a decision. Unseen weakness is implicitly priced at zero, which is a mathematical lie rather than a zero-risk state. The adversary does not respect your backlog SLA. Therefore, most findings should terminate in explicit, priced, dated, and owned risk acceptance, not immediate remediation.
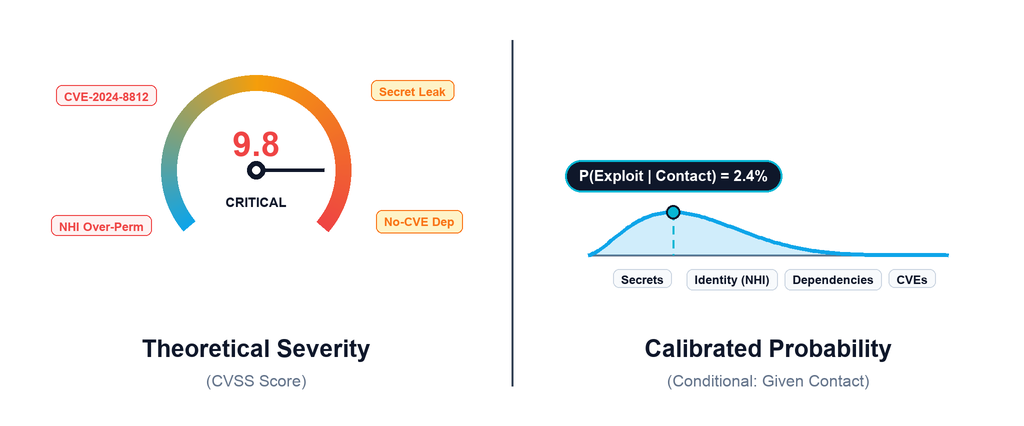
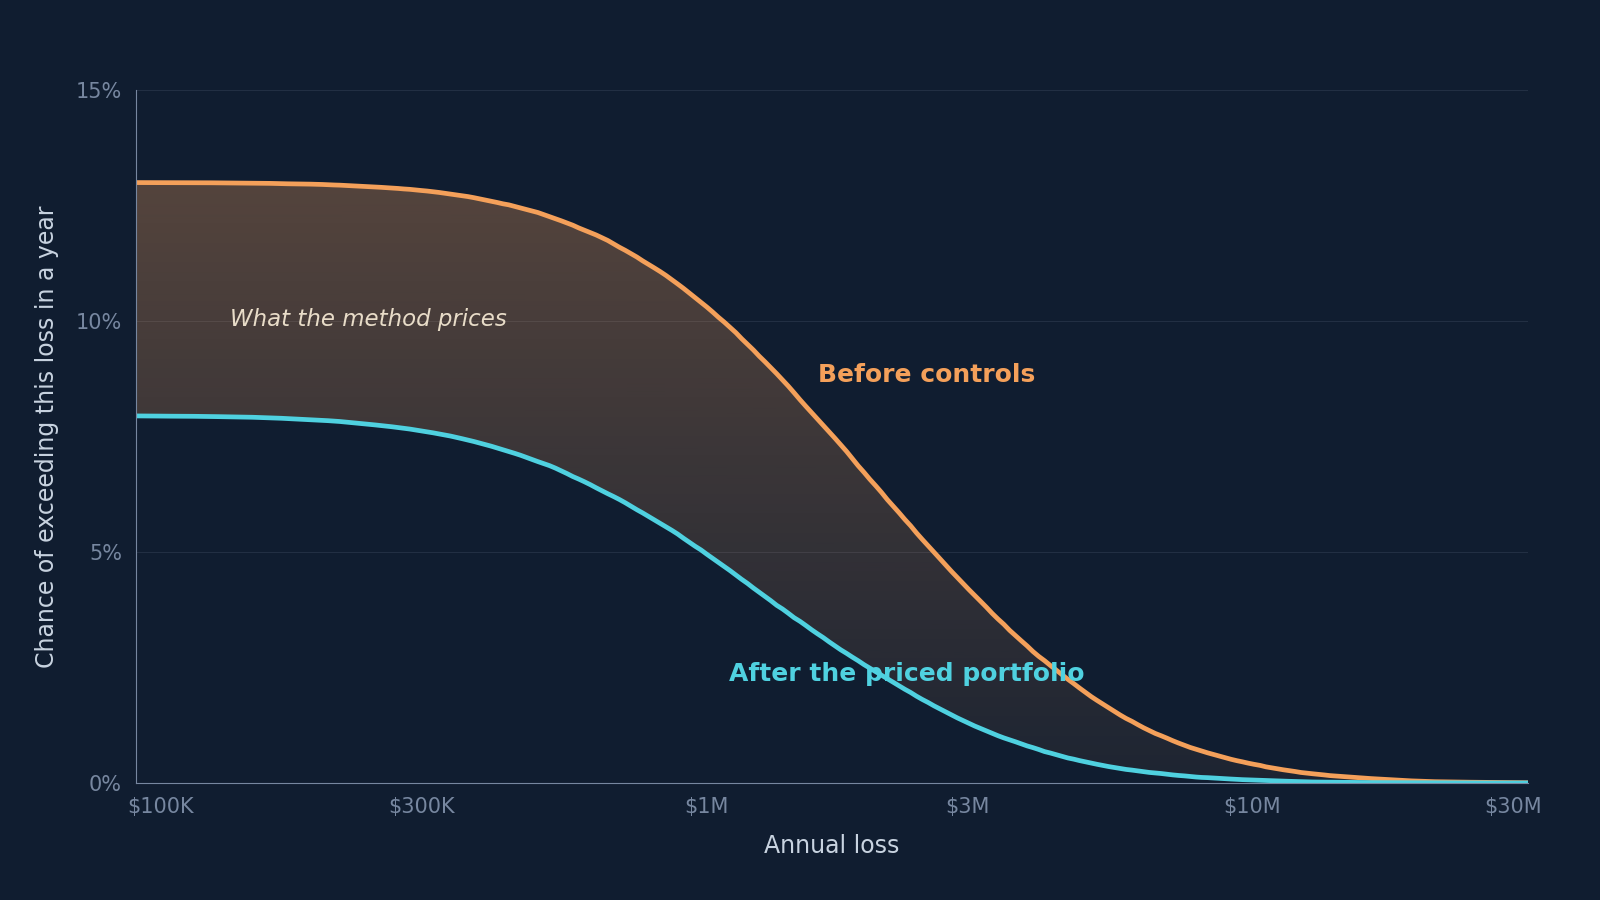
How to price a finding in practice: Pricing does not require a complex simulation for every ticket. It requires a coarse order of magnitude: annual event frequency multiplied by asset loss magnitude (). For estimating frequency across both CVEs and non-CVE findings (such as secrets or over-permissioned accounts), use the calibrated approach in Calibrated Exploit Estimates Beyond CVEs. Pair that with the scenario pricing model in Security Investment as Board Strategy to map findings to asset criticality tiers and exposure levels. An estimate bounded between $20,000 and $100,000 provides immediate governance utility; an implicit $0 valuation provides none. Defendable order of magnitude beats fake precision every time.
Deciding is cheap; engineering remediation is expensive. Conflating decision-making with remediation makes detection feel like punishment. Crucially, this transformation consumes zero engineering capacity. You cannot accept a risk you cannot see. Detection converts unacceptable-because-unknown risk into accepted-because-decided risk without spending a single engineering hour.
What to Measure Instead
Test any metric with one question: what does a team have to do to make this number look good? Run the industry’s default metrics through that question, and every one of them fails.
- Findings discovered. Punishes curiosity. The harder you look, the worse you perform on paper.
- Findings closed. Incentivizes clearing 100 cosmetic tickets over fixing one catastrophic database misconfiguration.
- Mean-time-to-remediate (MTTR). Ignores undetected vulnerabilities. Encourages teams to avoid scanning complex, high-risk systems to protect the average.
- Backlog size. Rewards head-in-the-sand behavior and arbitrary ticket deletion over actual risk reduction.
The replacement metrics share one property: the only way to make them look better is to actually reduce risk.
- Loss retired per unit of capacity. Evaluates economic efficiency. A cheap fix removing high expected loss beats an expensive fix with marginal risk impact.
- Queue displacement rate. Measures signal value. If a new scan surfaces 100 items but none displace the top of the sprint queue, the scan changed nothing. If 1 item jumps to #1, the scan paid for itself instantly.
- Total accepted risk (priced and summed). Aggregates explicit risk acceptances onto a single consolidated risk ledger, eliminating hidden risk accumulation in isolated tickets.
- Shadow price of capacity. Calculates expected loss retired by the next engineering resource, providing the business case for headcount rather than relying on raw backlog counts.
Immediate tactical takeaway: when a backlog is misordered, an hour spent re-ranking delivers higher loss-reduction ROI than an hour spent fixing the top item. Re-ranking is low-cost, risk-free, and requires zero engineering overhead. However, respect queue boundaries: re-rank at cadence checkpoints (such as sprint planning or quarterly reviews), not continuously, or team execution stalls.
A Backlog Is an Inventory, and the Three Dials
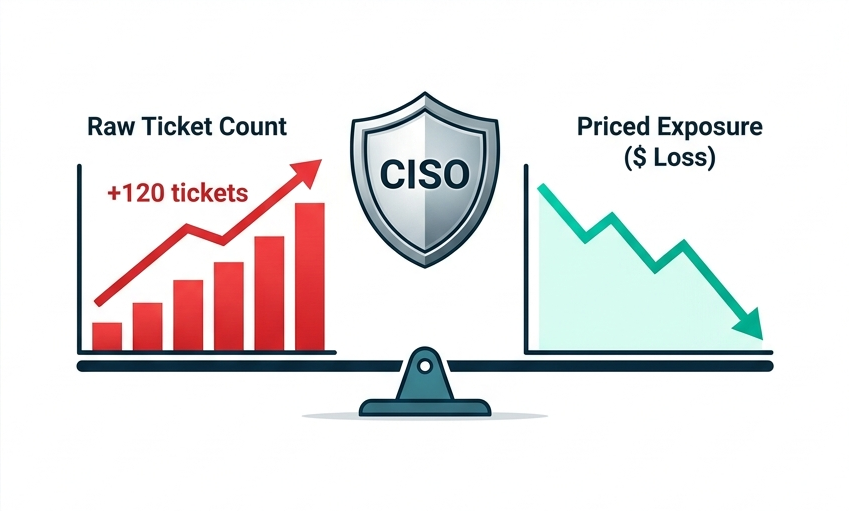
A backlog is an inventory, not a debt. Volume is irrelevant; total price is decisive, and the two frequently diverge. A team that remediates one critical database exposure while ingesting forty cosmetic bugs expands its backlog count while dramatically improving its risk posture. Standard dashboards mark this as failure; priced inventory reveals it as victory. A growing ticket count paired with falling priced risk, active queue-head execution, and high-displacement detection defines an elite security program.
A quantitative risk estimate relies on three dials: magnitude (mean loss), certainty (confidence interval), and recency (last observation timestamp). Continuous monitoring tightens certainty and recency automatically across every asset.
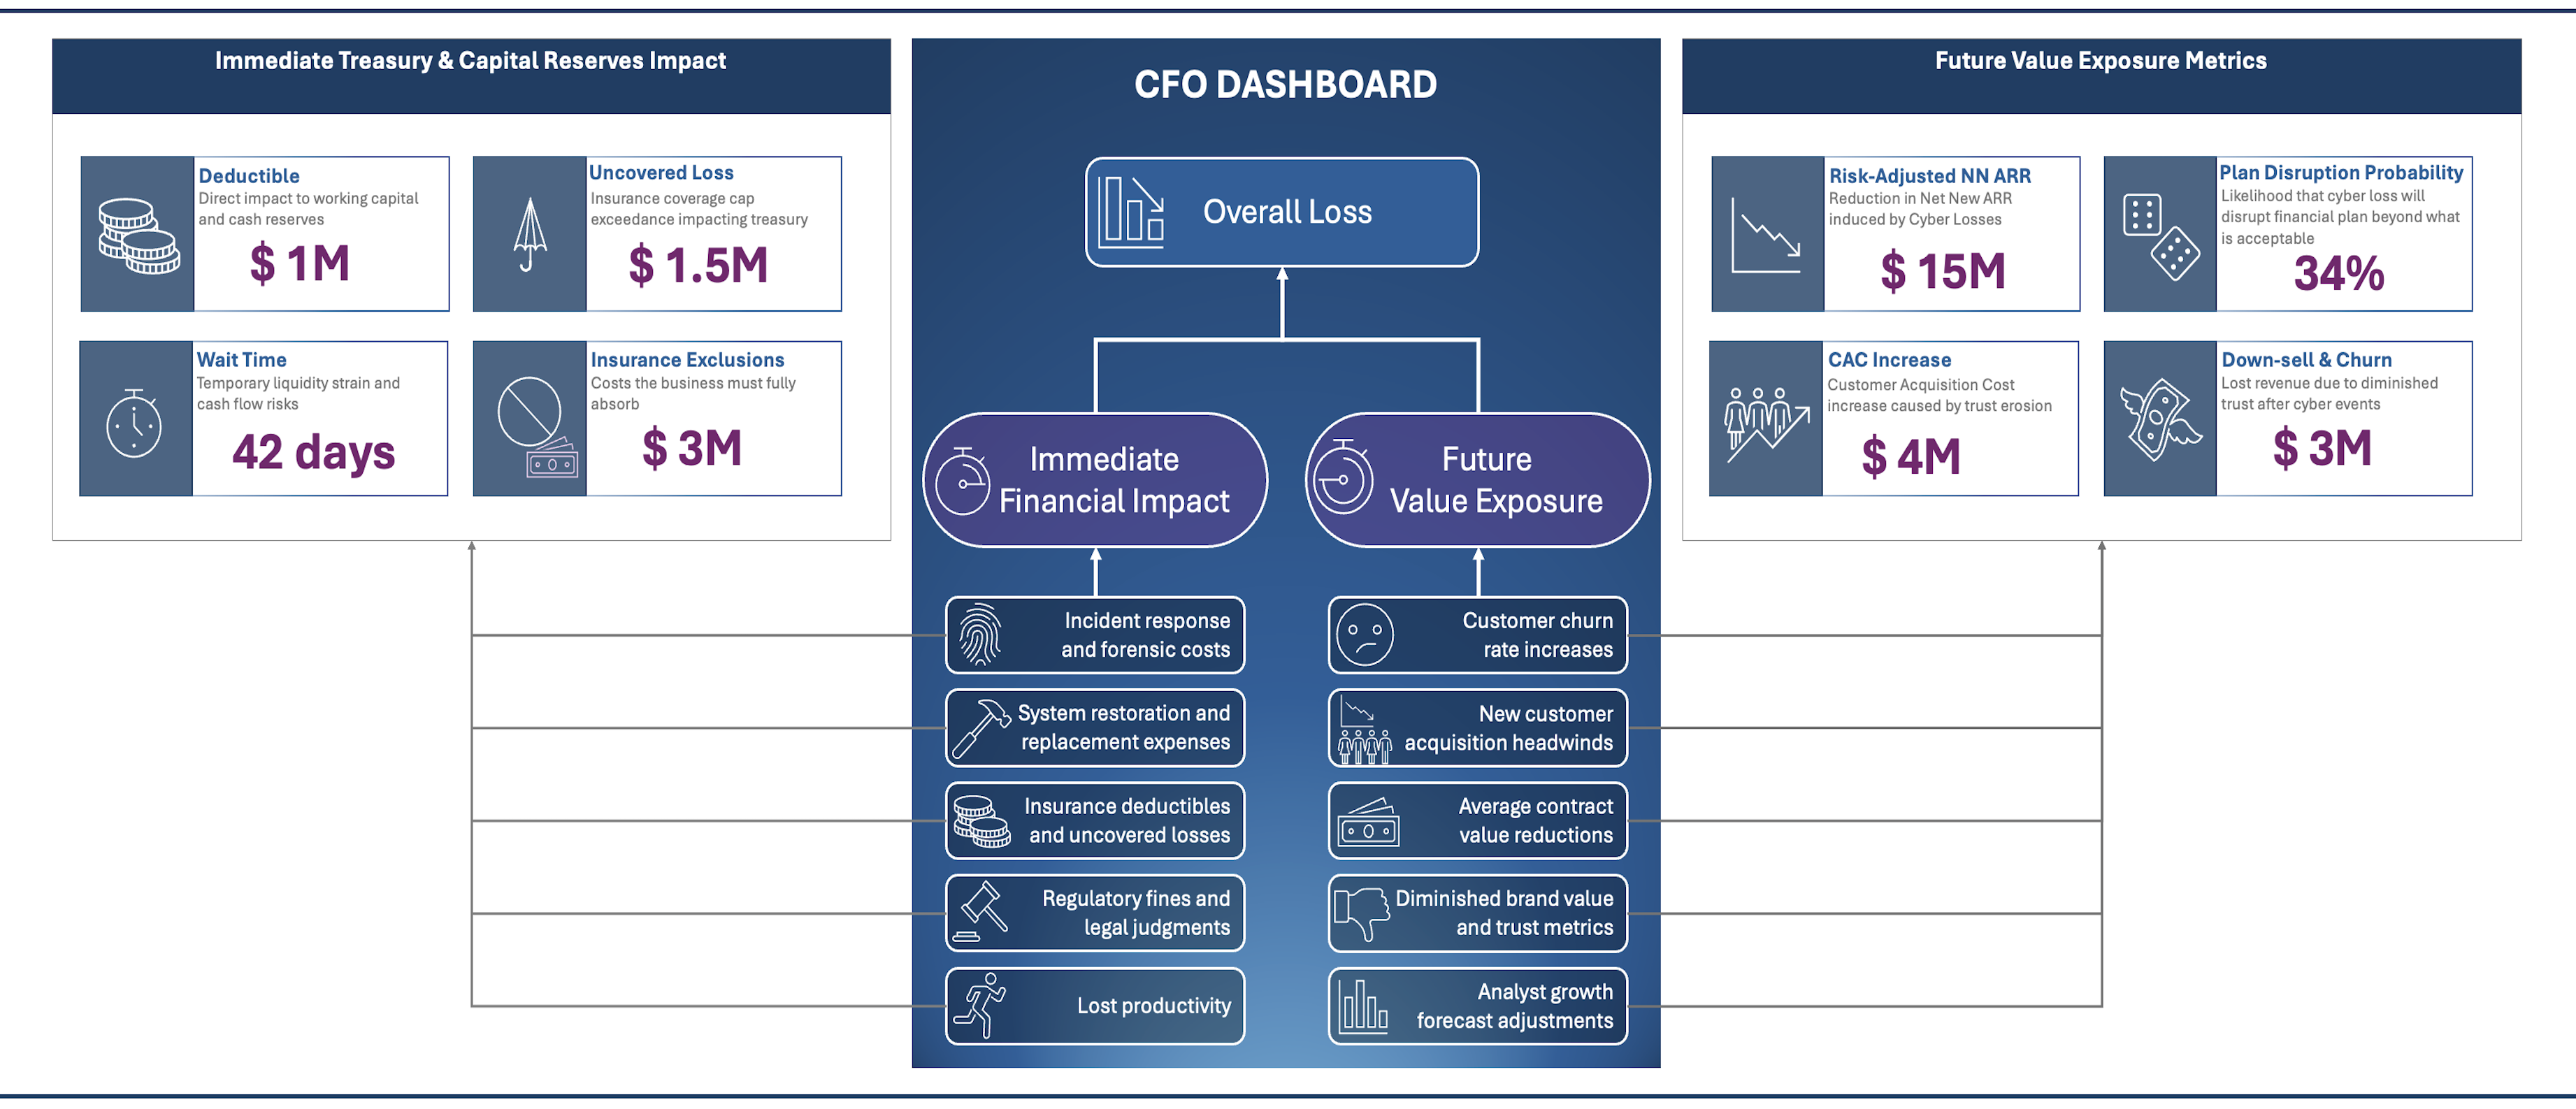
There is a fourth variable, not an estimation dial, but a capital allocation decision: remediation capacity. As established in Security Investment as Board Strategy, capacity is a board-level risk appetite decision, not an engineering performance score. A risk model that allows superior detection and triage to mask an under-resourced remediation queue improperly absorbs board-level governance decisions.
CISO Talking Points
Executive execution relies on timing over phrasing. Deliver the first point before new telemetry goes live. Forewarn the board of an upcoming open-findings surge caused by expanded visibility. When the count jumps on schedule, it proves diagnostic precision rather than operational failure. Always present the visibility-versus-world-change split explicitly on the page, and pre-brief the Audit and Risk Committee Chair so governance alignment is locked in before the meeting starts.
“We forewarned you last quarter. The open-findings count rose because our instruments improved, not because our estate deteriorated.” A belief correction is evidence the monitoring is working. Conflating it with a world change is the actual failure mode.
“Here is the split every quarter: how much of this movement is new visibility, and how much is physical estate change.” That split is shown on the page, not asserted in verbal claims.
“A finding is a decision prompt, not a mandatory fix.” Acceptance, priced and dated, is a legitimate, successful outcome. Fixing everything was never the goal; deciding about everything is.
“We manage backlog financial value, not ticket counts.” Backlog count can rise while priced risk falls. We show both every quarter because only one reveals if the program is working.
“Remediation capacity is a budget decision, not a performance score.” Tell us what the next unit of remediation capacity is worth in retired expected loss, and we will show where it stops paying.
“What am I not seeing?” is the question every security leader lives with, whether new to the role or ten years in. This framework shrinks that answer honestly, replacing comfortable guesswork with calibrated metrics.